Hi folks,
I have a question regarding the result of Mummichog using RT and pval, particularly the number of Hits (sig) I got in the detailed result table. column definitions from the detailed result table are as follows:
- Pathway total: The total number of empirical compounds in the pathway.
- Hits (all): The total number of empirical compound hits from the user’s data.
- Hits (sig): The minimum between either the total number of empirical compound hits or the number of m/z hits that are considered significant based on the user-provided p-value cutoff.
- Expected: The expected number of empirical compound hits in the pathway.
Also, the enrichment factor (EF) is defined as follows:
- Enrichment Factor of a pathway is the ratio between the number of significant pathway hits from the user uploaded data and the expected number of hits within that pathway.
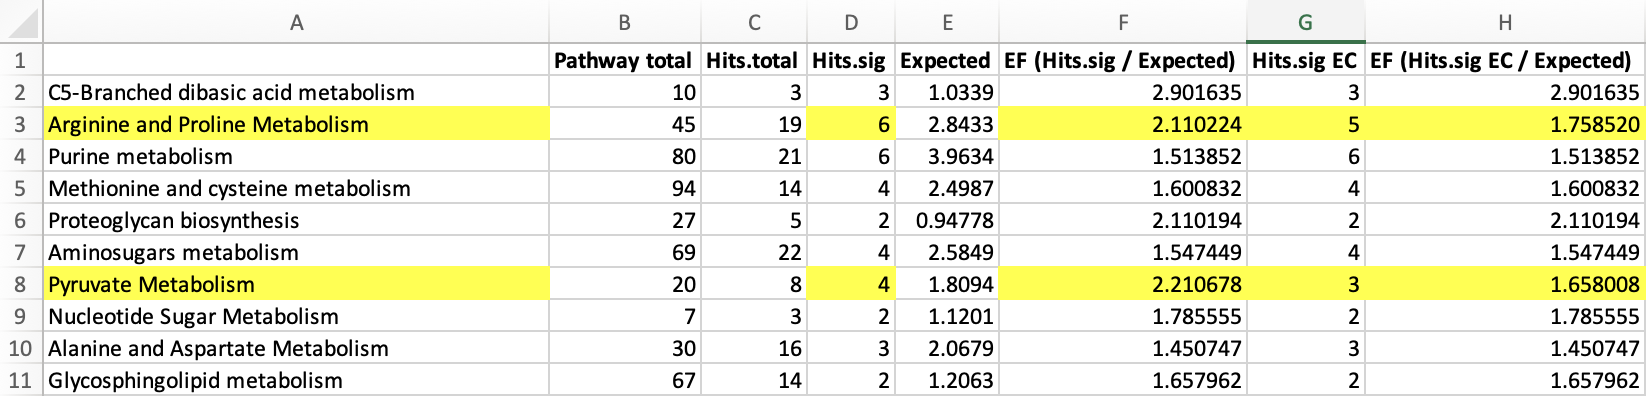
Intuitively, to get the EF, I just divided “Hits (sig)” column by “Expected” column. However, I noticed that the resulting EFs were not consistently matching the values displayed on the scatter plot. To get the correct EF values, one need to download the result table and count the number of empirical compounds listed in the last column (“cpd.hits”) as significant hits.
Upon inspecting the function .compute.mummichogRTSigPvals in peaks_to_function.R, I found that it seems like the “Hits.total” and “Hits.sig” are from Compound list (instead of Empirical Compound list). Given that all the calculation are based on the empirical compounds (ref: What are empirical compounds and how they are calculated (mummichog)?), it might make more sense (I guess) to return the count of empirical compounds, plus users don’t get their hands dirty to calculate the number of empirical compounds.
I have also attached screenshots below to better illustrate the problem.
Description:
EF for Arginine and Proline Metabolism:

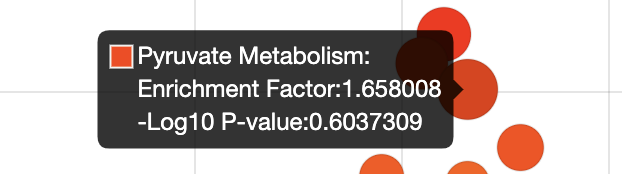
EF for Pyruvate Metabolism:
Use “Hits (sig)” column and “Expected” column will get inconsistent EF value.
For Arginine and Proline Metabolism pathway, the match detail show compound list instead of emprical compound list.
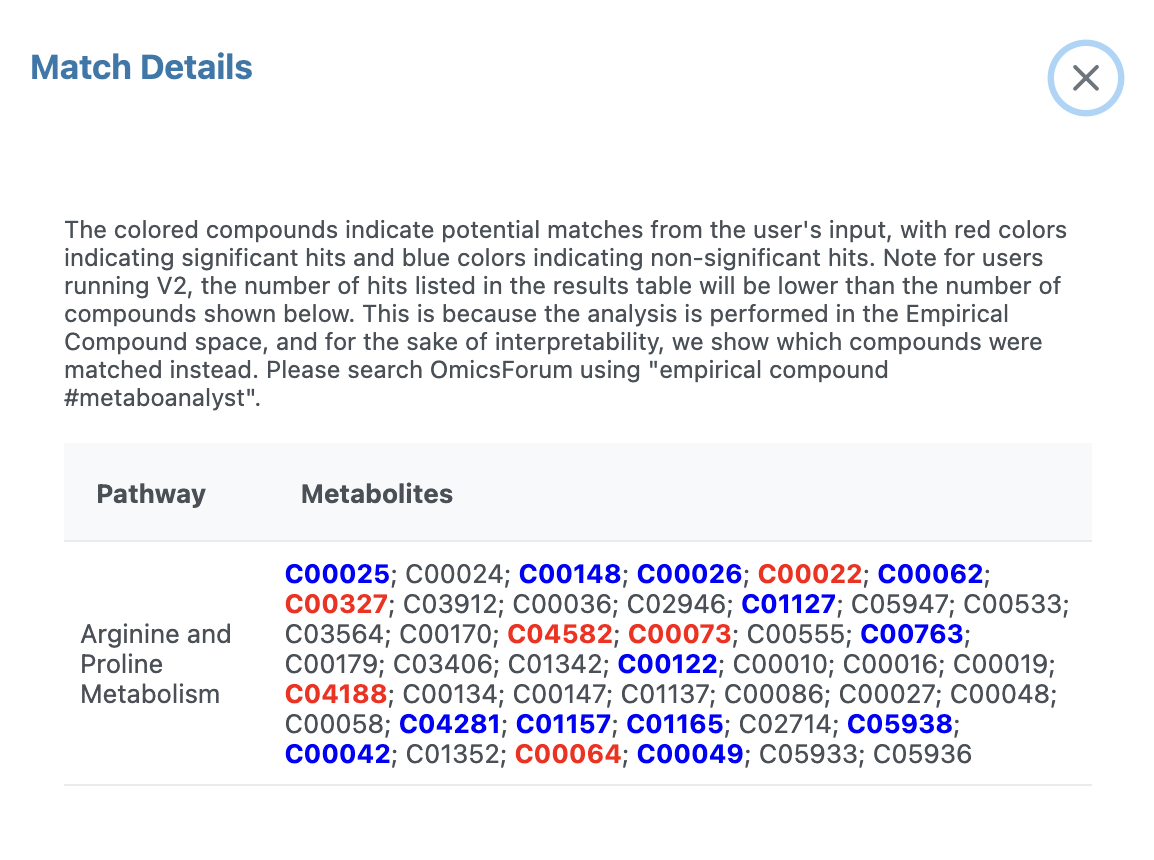
On the other hand, the downloaded result table returns five empirical compounds (EC0001;EC000152;EC000302;EC00045;EC00033).
Steps to reproduce the behavior:
- Upload the file.
output.neg.pval.test.csv (239.0 KB) - R Command History:
mSet<-InitDataObjects("mass_all", "mummichog", FALSE)
mSet<-SetPeakFormat(mSet, "rmp")
mSet<-UpdateInstrumentParameters(mSet, 5.0, "negative", "yes", 0.02);
mSet<-Read.PeakListData(mSet, "Replacing_with_your_file_path");
mSet<-SanityCheckMummichogData(mSet)
mSet<-SetPeakEnrichMethod(mSet, "mum", "v2")
mSet<-SetMummichogPval(mSet, 0.1)
mSet<-PerformPSEA(mSet, "hsa_mfn", "current", 3 , 100)
mSet<-PlotPeaks2Paths(mSet, "peaks_to_paths_0_", "png", 72, width=NA)
Expected behavior
The list and number of empirical compounds should be returned.
I would appreciate any clarifications. Thank you.
Best,
Jiung-Wen