I would like to raise this concern regarding plotting values.
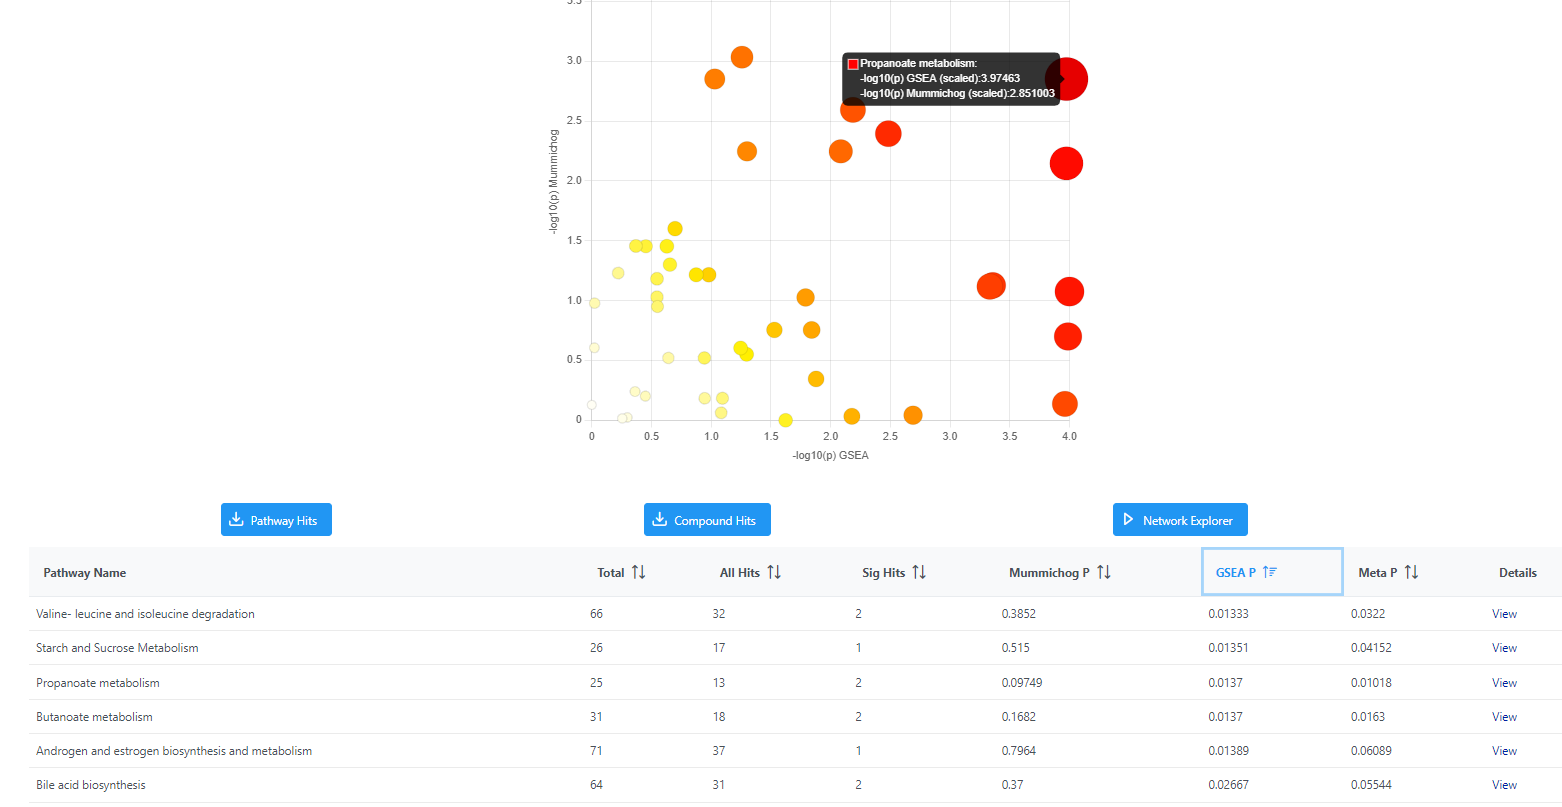
As seen in the image, the -log10 values in the plot and the computational -log10 values were different. Although it was written scaled, does it mean that values were adjusted just so that it will fit a 4.0 x 4.0 square plot?
Thanks for your time!