Hello!
When using the MetaboAnalyst 6.0 Pathway Analysis module, using a list of compound names and a self-specified reference metabolome, I get the following results:
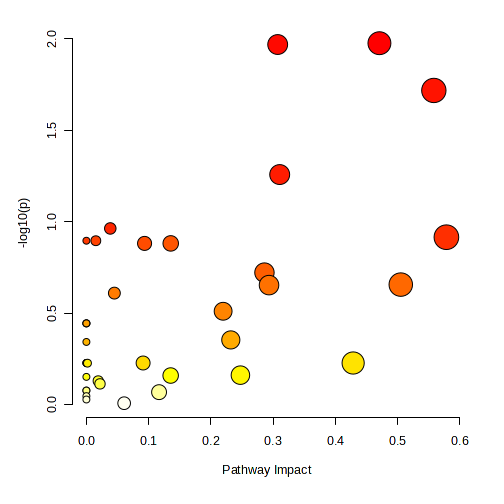
and the list of impacted pathways is led by Glycolysis / Gluconeogenesis (hsa00010), 13, 4.67, 9, 1.06E-02, 1.98E+00, 5.92E-01, 3.01E-01, 0.47.
However, using MetaboAnalystR, using the same settings (relative betweenness centrality, hypergeometric test) and setting the metabolome filter using the same list of KEGG compounds as previously (using `mSet<-SetMetabolomeFilter(mSet, T)
mSet<-Setup.KEGGReferenceMetabolome(mSet, “data//KEGG_list_PCDL.txt”)`)
I get different results.
The pathway impact graph looks like this:
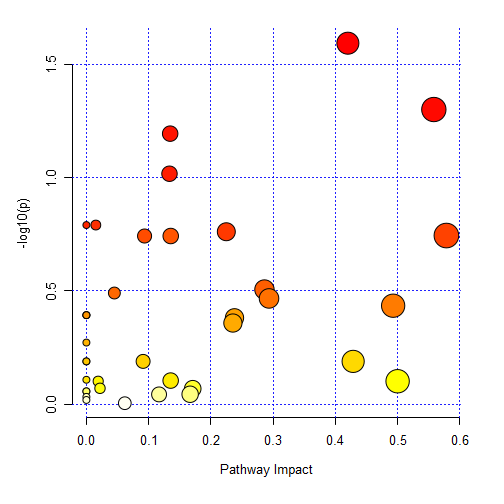
and whilst the top result for impacted pathways is the same, the rest are different, and the results for Total/Expected/Hits/Raw p value/-log10p/Holm adjust/FDR/Impact are all different.
What could the reasons for this be, and which set of results should I trust?
Thank you!