Hi, thanks so much for developing such a helpful online site; I am unclear about the fold change calculation for paired data and would like to ask you for some advice.
In excel, I used the day01 concentration of metabolite A for each subject, divided by the day28 concentration to get the result in the foldchange column and found the mean value of these 9 fold changes to be 225.1389472.
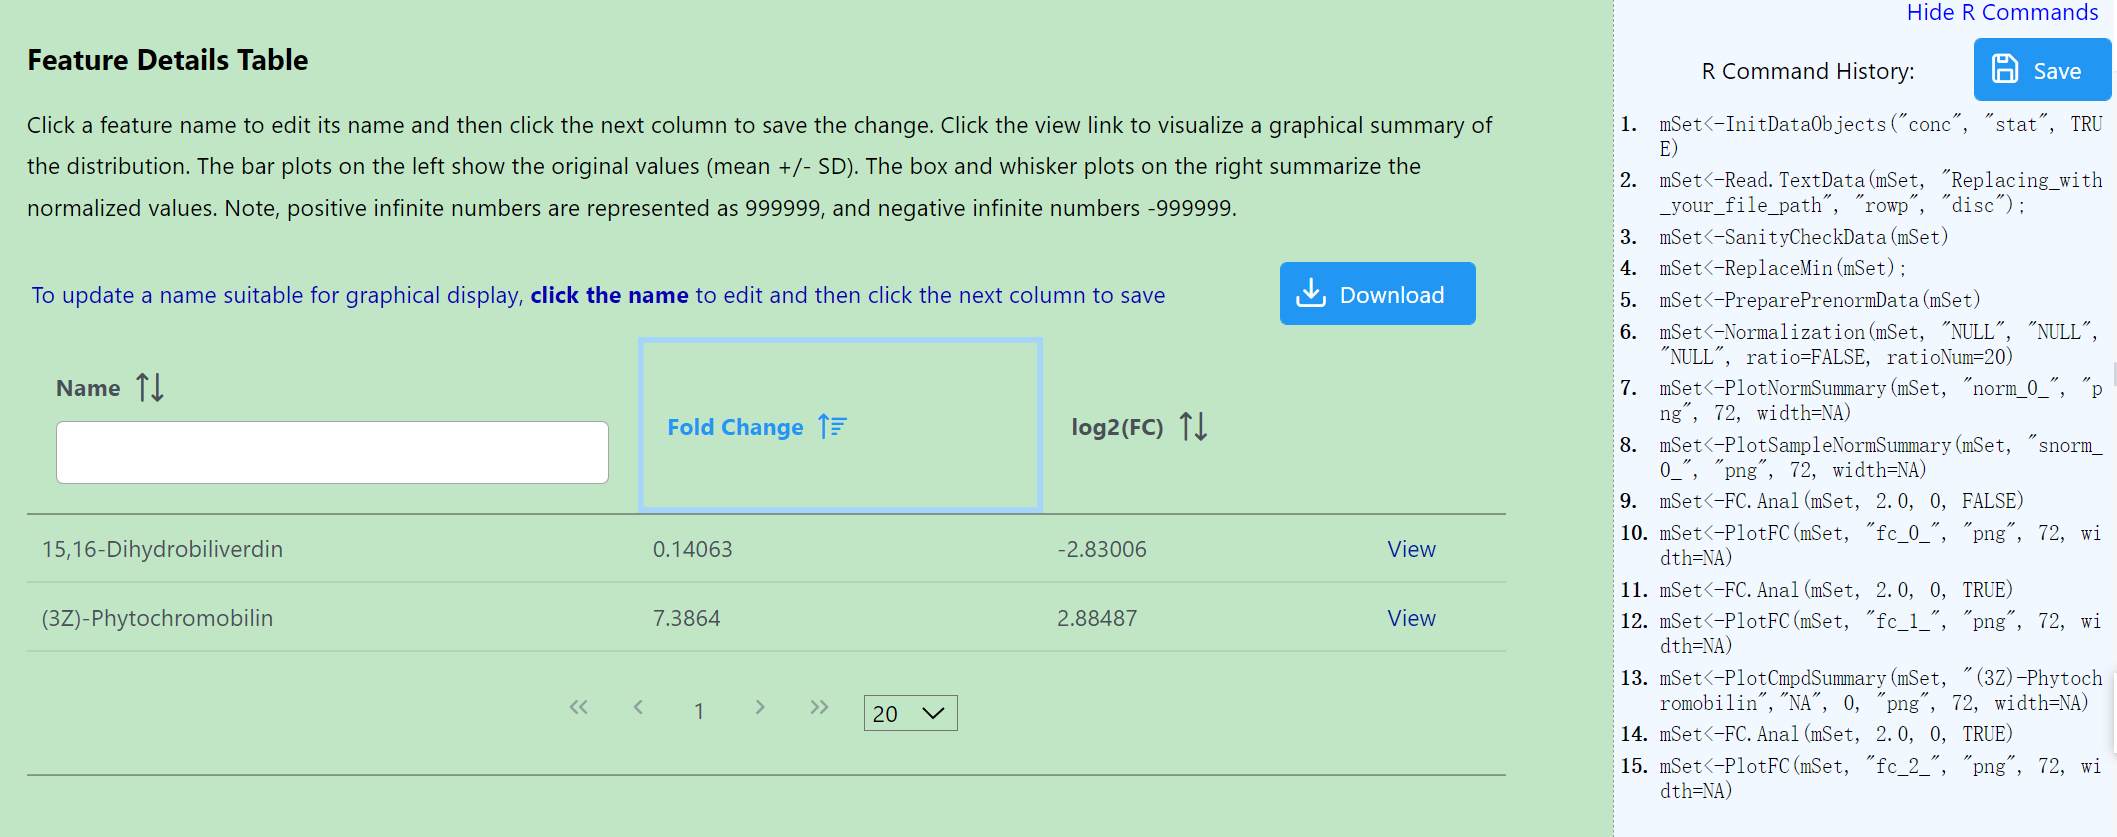
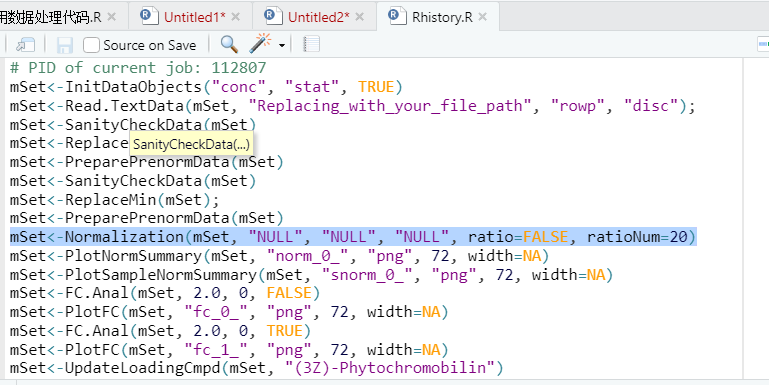
However, when I put the same data into the MetaboAnalyst website (including all metabolites, not just A_unsure), I get a different calculation, with the FC result for A_unsure being 7.3864 and log2(FC) being 2.88487.
I am baffled as to what the problem is and am looking forward to your help!
here mydata
Sample | paried_group | A_unsure | (01/28)foldchange | mean_foldchange
people0101 | -1 | 0.004127571 | 0.031645023 | 225.1389472
people0201 | -2 | 0.83822522 | 34.23023572 |
people0301 | -3 | 0.106605361 | 2.410679456 |
people0401 | -4 | 0.631875643 | 2.907502789 |
people0501 | -5 | 0.572538855 | 835.1818239 |
people0601 | -6 | 0.904662272 | 1.369159927 |
people0701 | -7 | 0.842034249 | 5.33574297 |
people0801 | -8 | 0.063300182 | 1.235493619 |
people1001 | -9 | 0.792196475 | 1143.548242 |
people0128 | 1 | 0.130433495 | |
people0228 | 2 | 0.02448786 | |
people0328 | 3 | 0.044222122 | |
people0428 | 4 | 0.217325894 | |
people0528 | 5 | 0.000685526 | |
people0628 | 6 | 0.660742587 | |
people0728 | 7 | 0.157810122 | |
people0828 | 8 | 0.05123473 | |
people1028 | 9 | 0.000692753 | |
and in web ,the paired fc result is 7.3864