Hi,
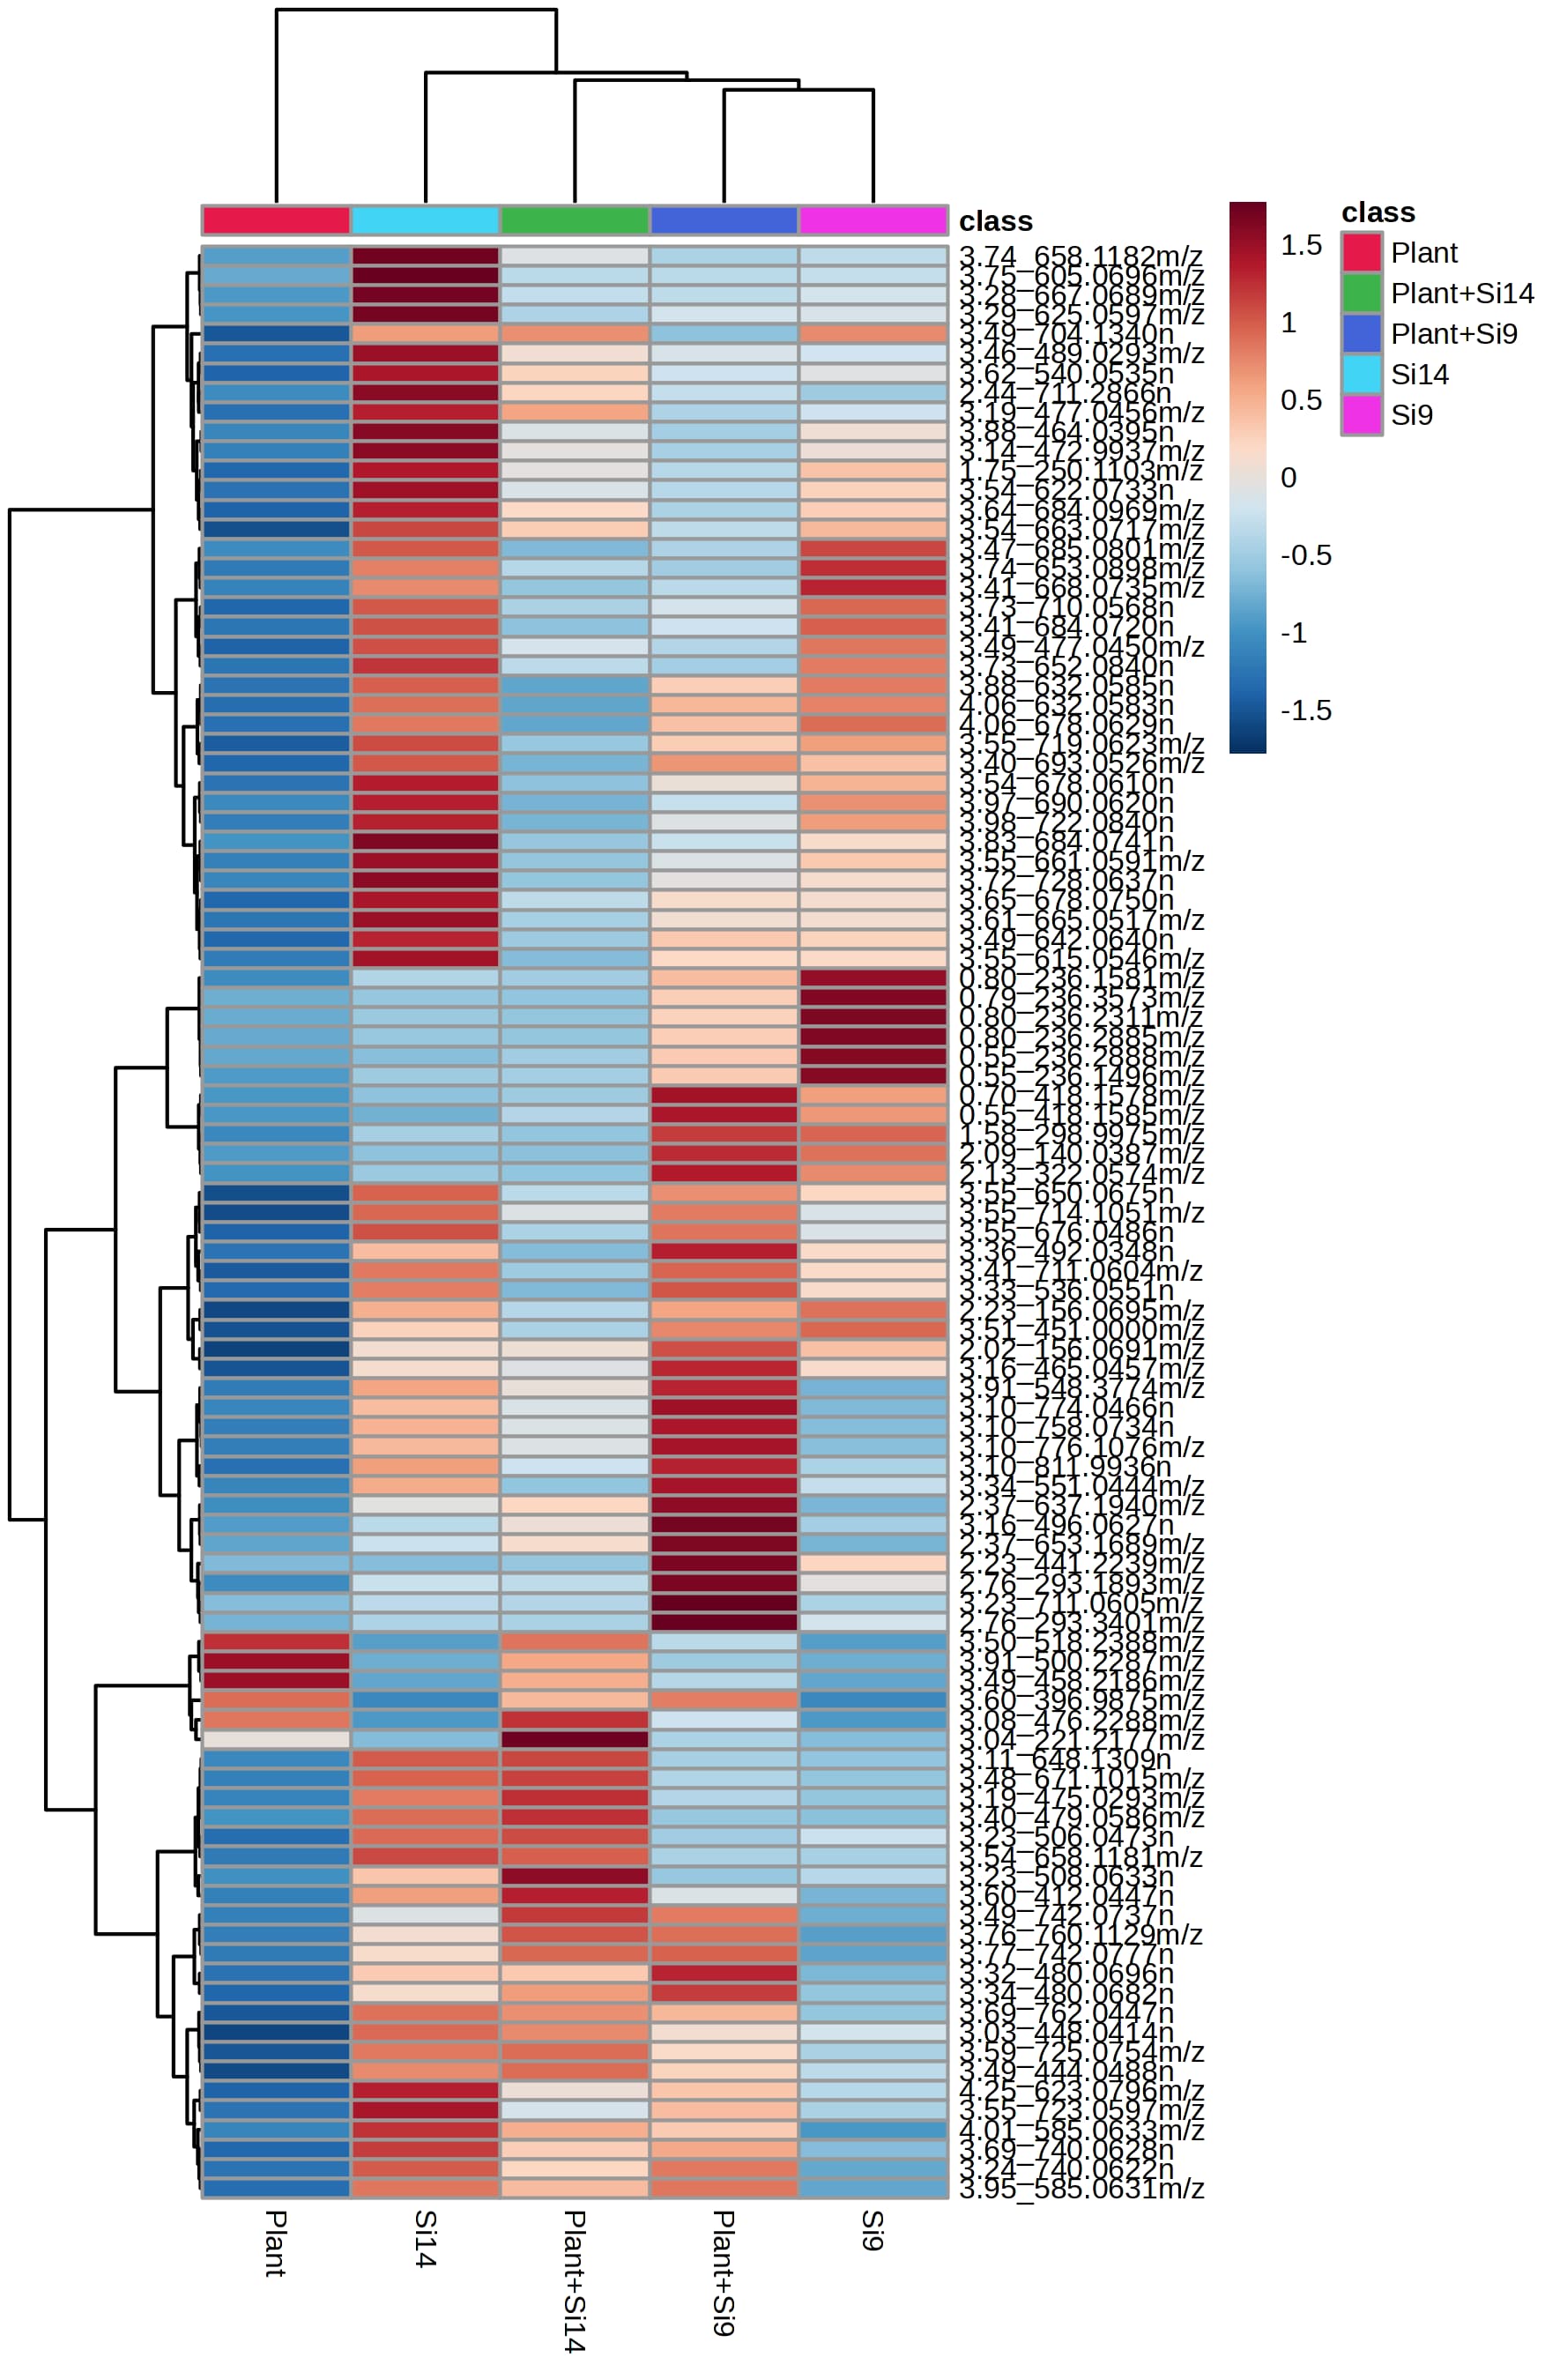
I have created the heat map using LC-MS metabolomics data. Since I had a lot of significant features so I wanted to narrow it down. So I used ‘Use top’ with t-test/Anova option. After selecting it to 100 features, I got the heatmap with top 100 features as in image below:
However, while being on the same page when I change it to Top 50 and Top 25, I get different feature results in heat map (below images)
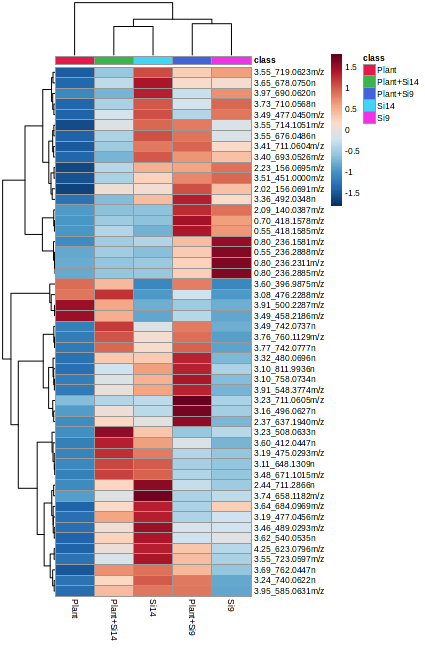
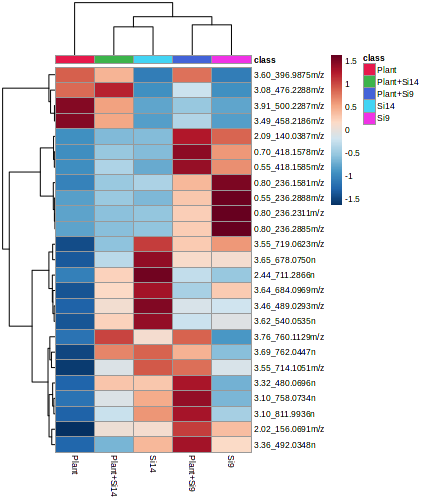
I want to know that what type of analyses is performed here that give different results. I assume/thought it should be like Anova is applied to whole dataset that I uploaded and should give same results and extract top 25 or 50 or 100 features from that.
I am curious to know about the test being performed here and how is it done?
Thanks and best,
/K