After uploaded and processing a CSV file in the “statistical analysis [one factor]” module and then proceeding to the PCA 2D Scores Plot, errors appear when altering the “Colors & Shapes” with the “Graphics Center” (palette icon). For instance, when several different groups are in the dataset and then the groups’ shapes are altered, the icons are not correct in the PCA scores plot. (Note: I am unsure of the exact number of groups when the error is first apparent.)
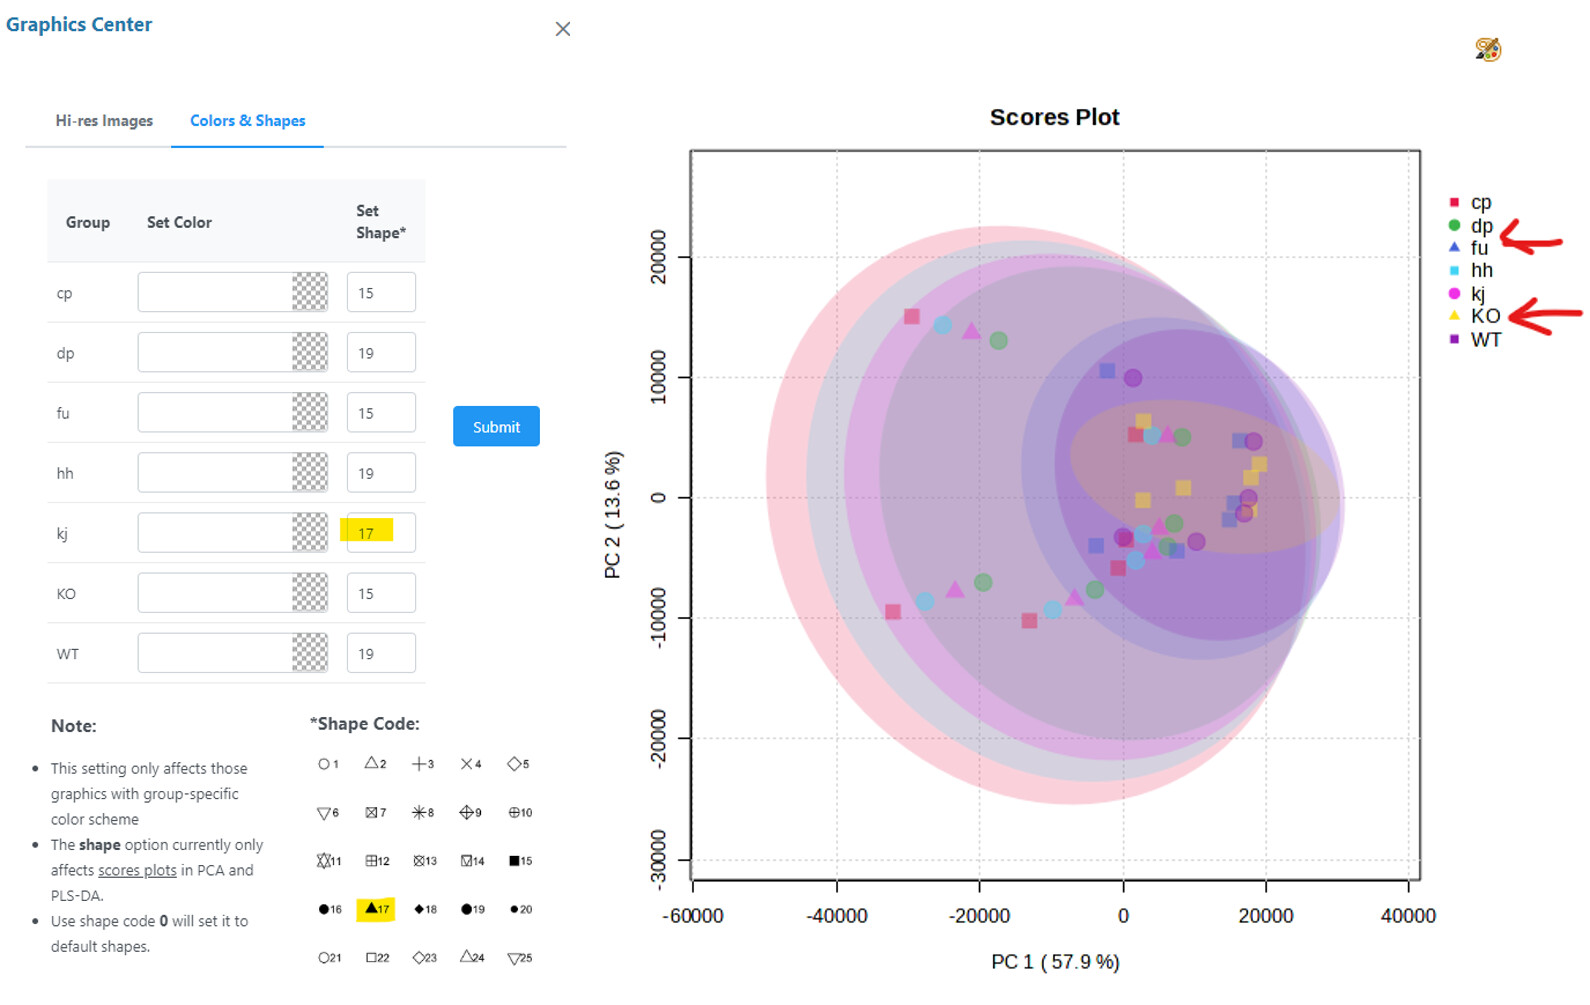
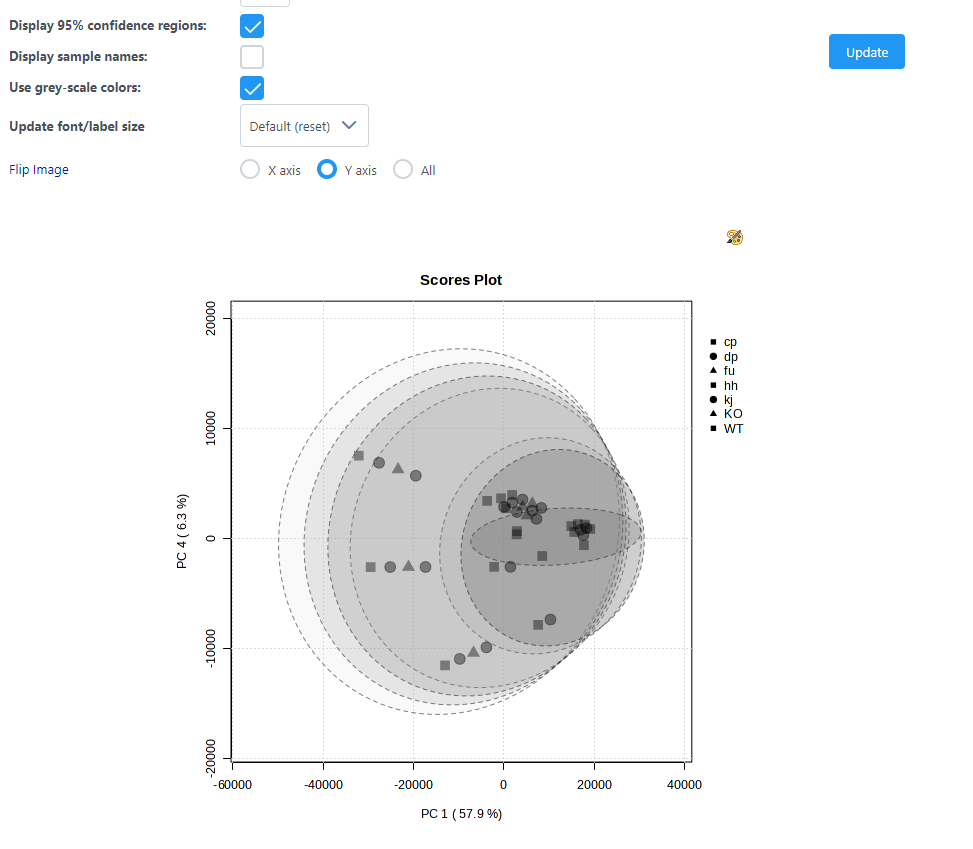
Furthermore, when the colors are altered, the PCA scores plot simply does not appear unless “Use grey-scale colors” is selected.
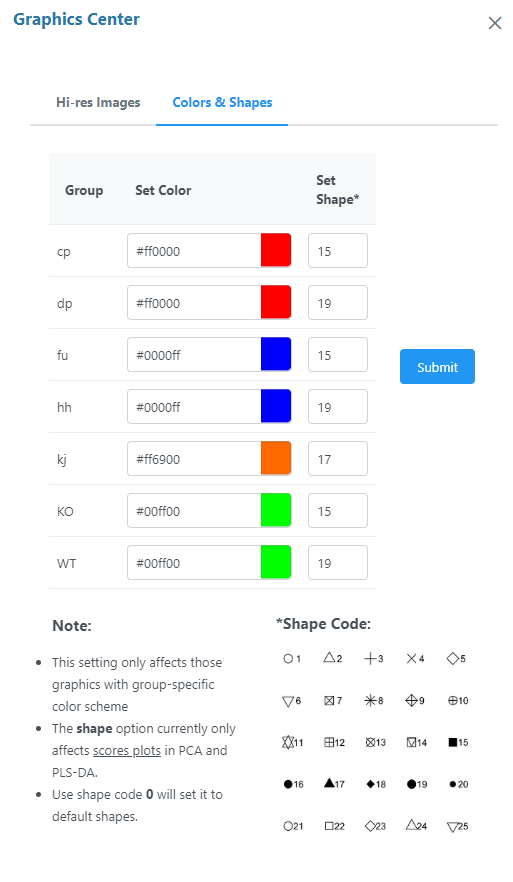
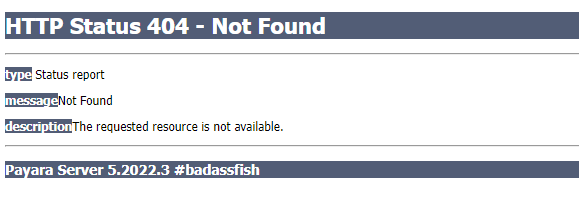
If trying to view the seemingly invisible colored plot using the “High-res Images” in the “Graphics Center” (palette icon), then the resulting browser tab shows an server error.
The dataset used the “MS peak intensities” test data provided in the module, but expanded with more groups to demonstrate the aforementioned error.
lcms_table.csv (183.9 KB)