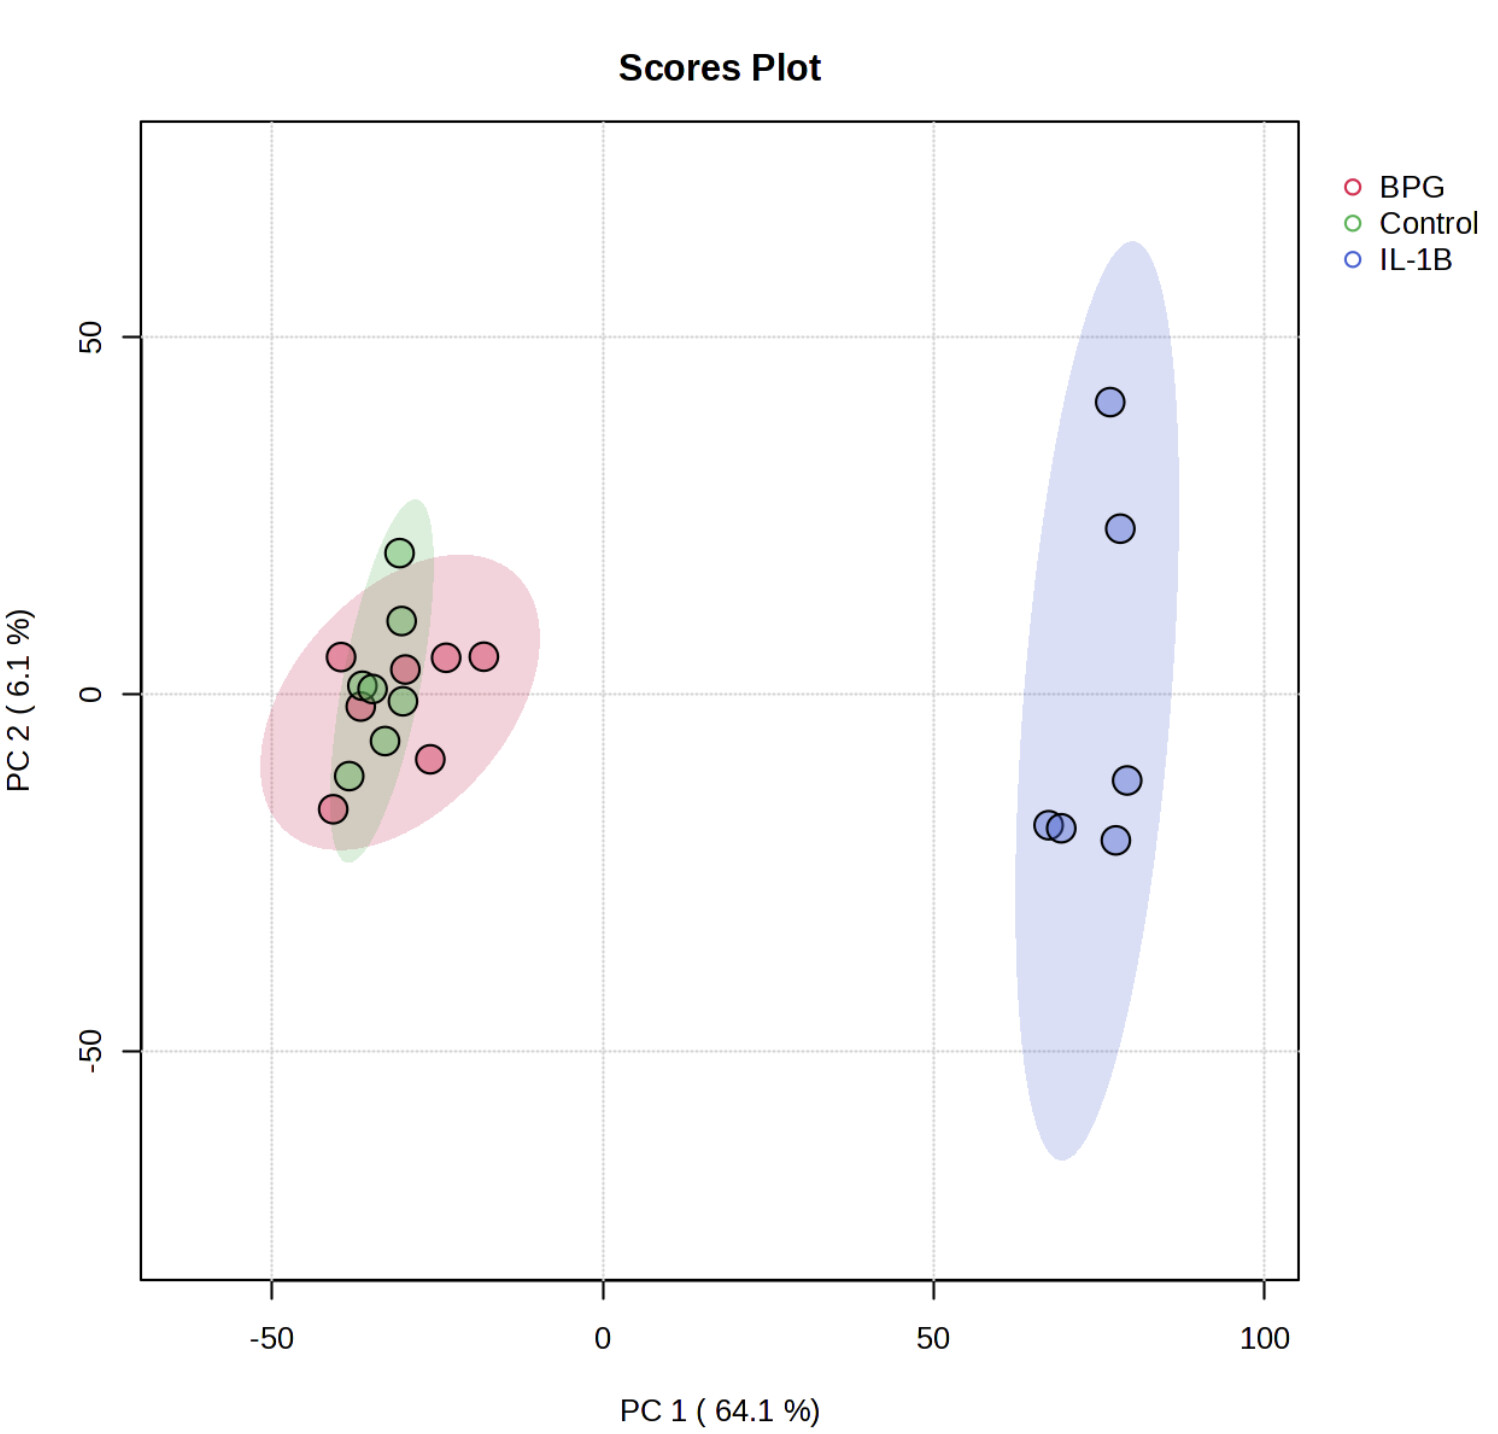
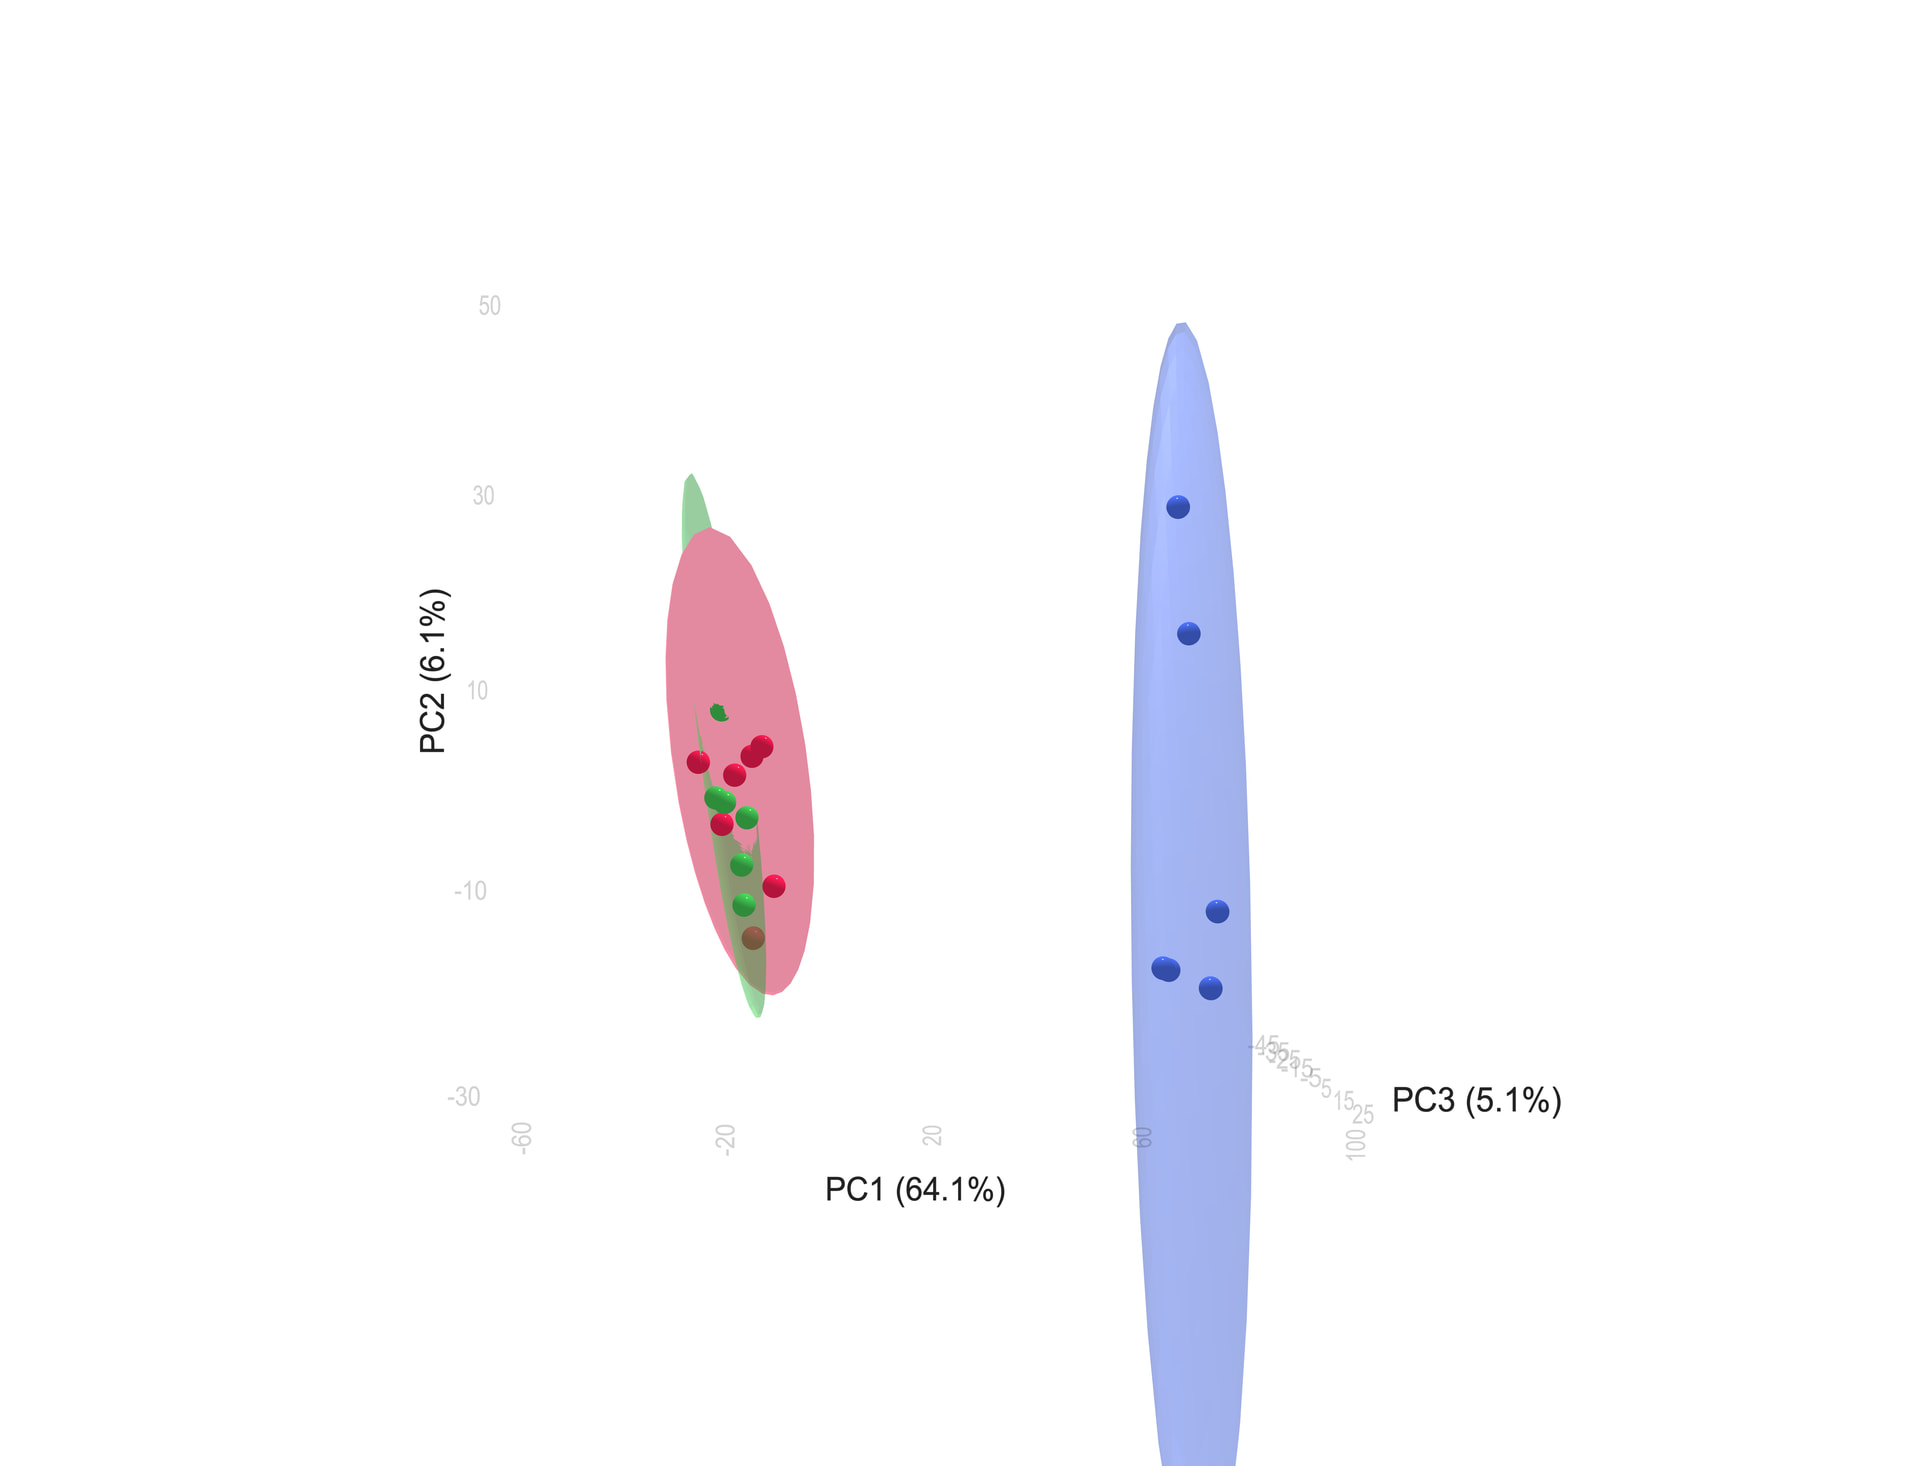
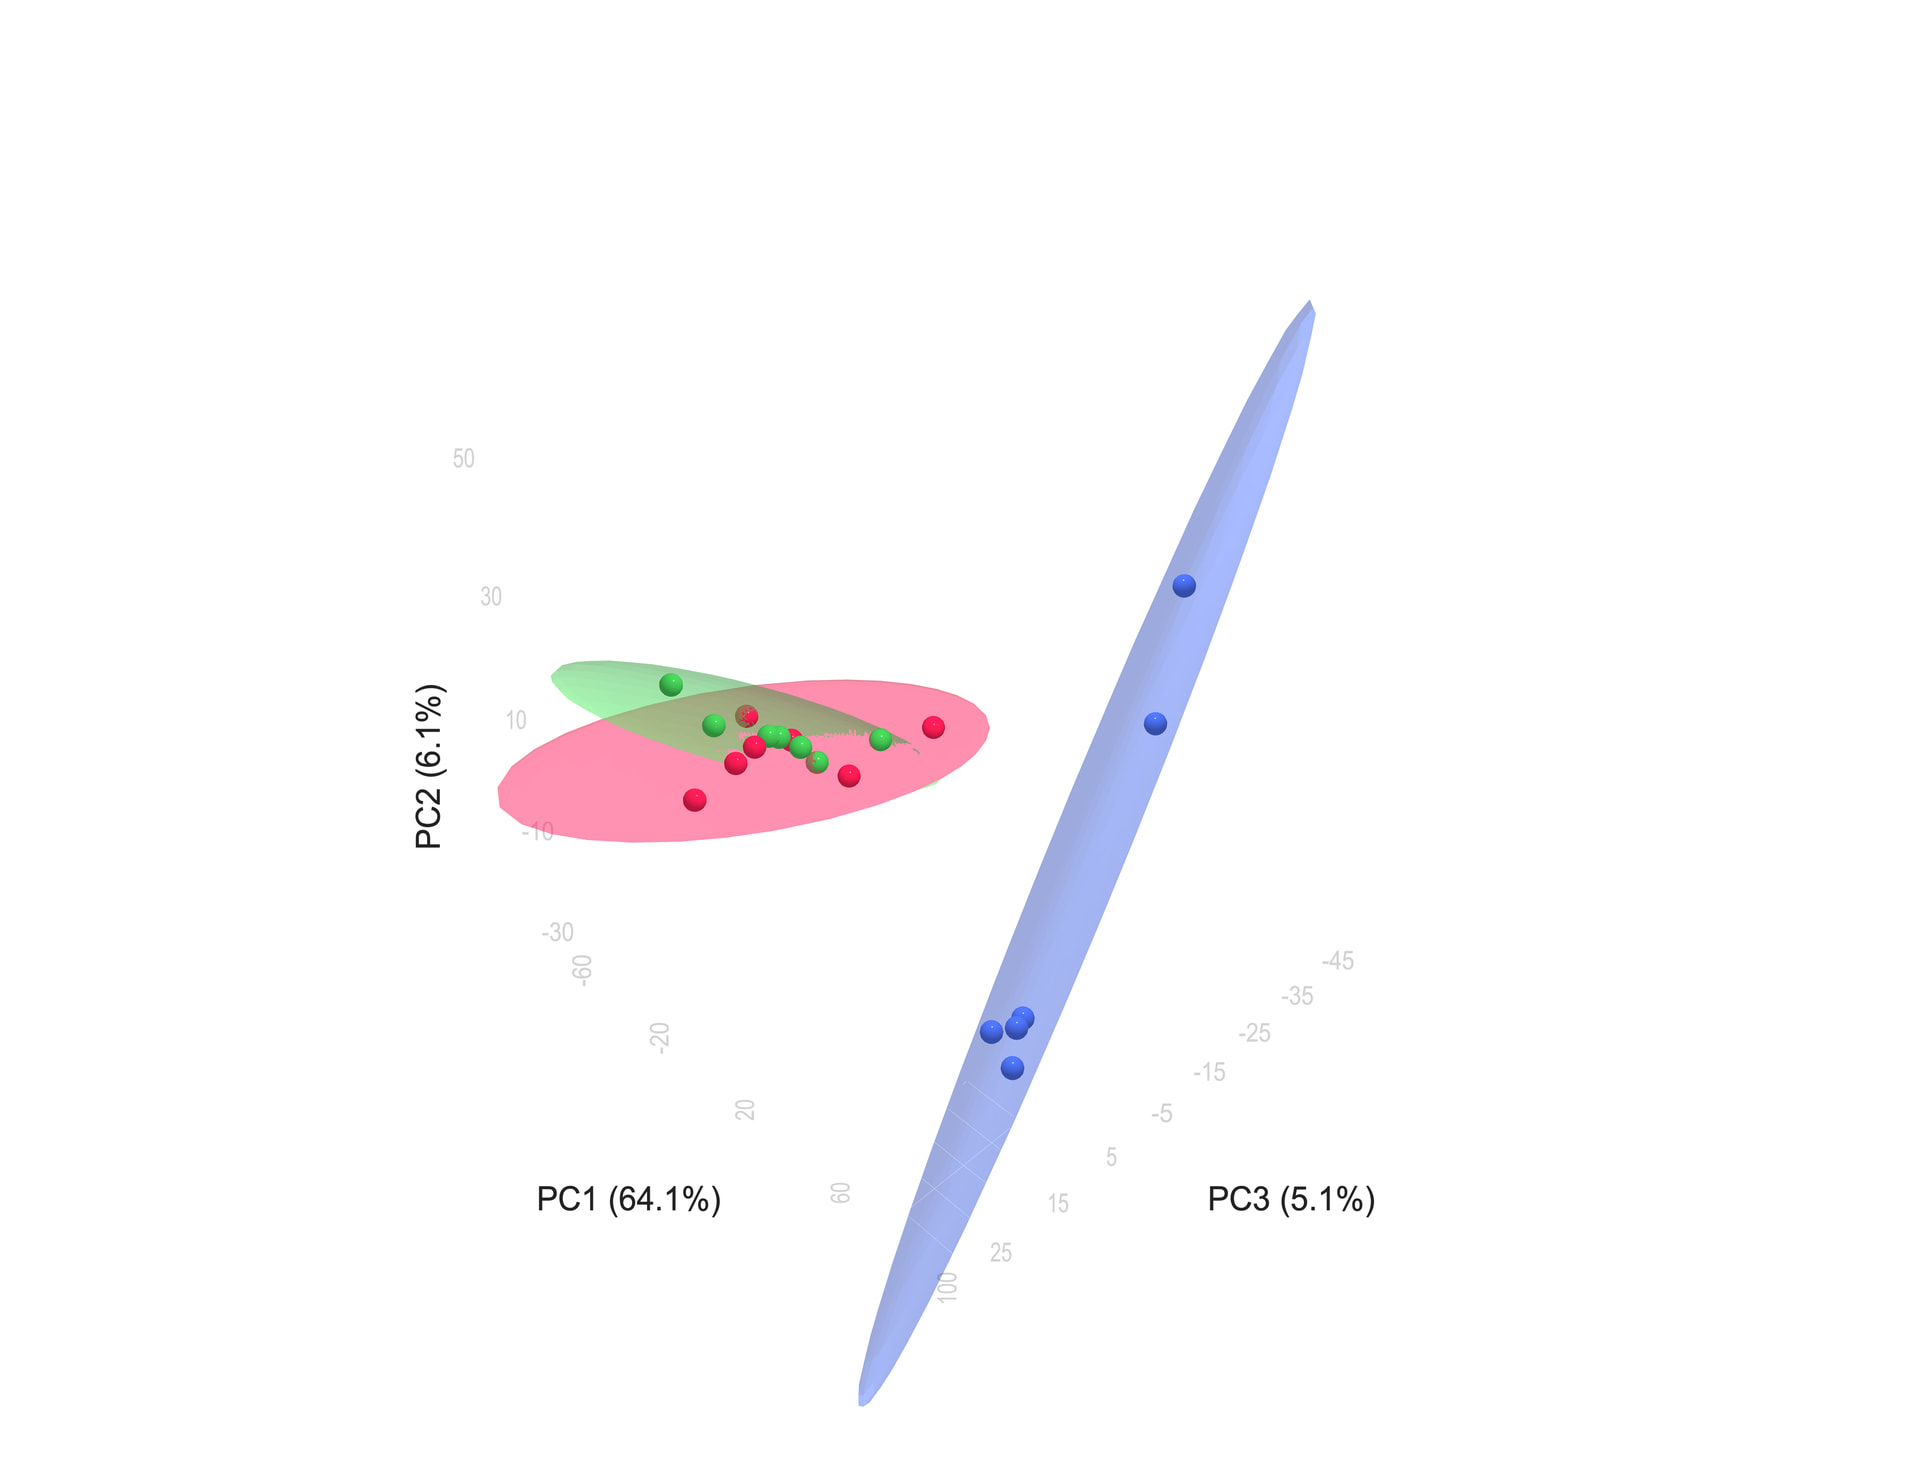
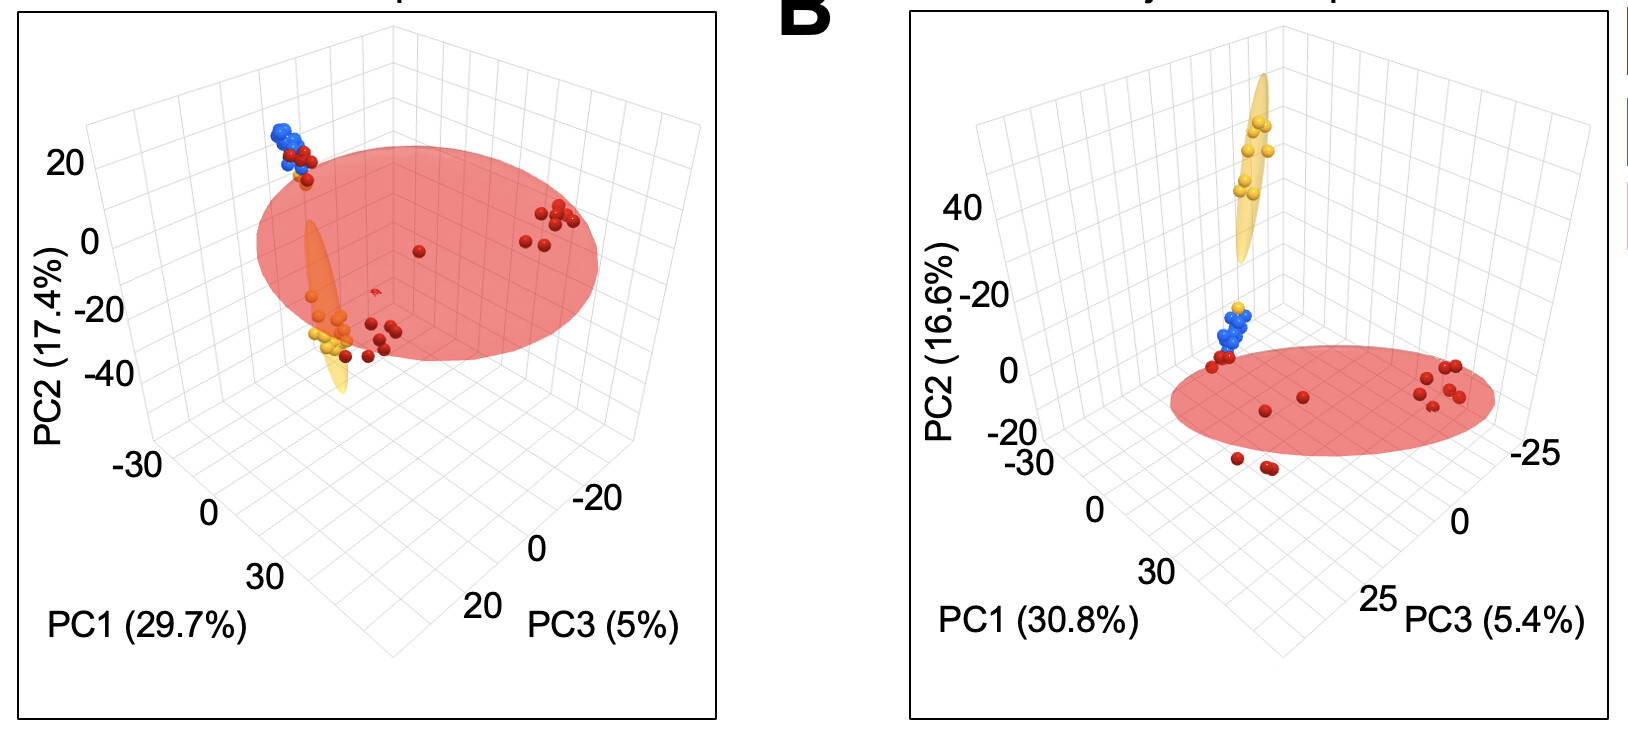
Hi there! I am analyzing some untargeted metabolomics data and would love to use the 3D PCA plots, but I have noticed that the confidence intervals always turn out weird and way off the graph. Additionally, the grid in the background is invisible when you download the PNG now, and none of the settings I mess with seem to change that. Am I doing something wrong? I am using the browser version and will upload my file, settings, and pics to show what I mean. I have also included a plot for how it usually looks (from a different set of data). Thanks!
Settings:
Peak intensities, samples in columns
No IQR or other filtering
Left-censored data estimation (LoD) for dealing with missing values
No normalization (we use normalized data from Progenesis)
Log10 transformation
Auto-scale
14. Ctrl vs BPG vs IL-1B.csv (943.8 KB)