Hello everyone,
Thanks for developing this useful software.
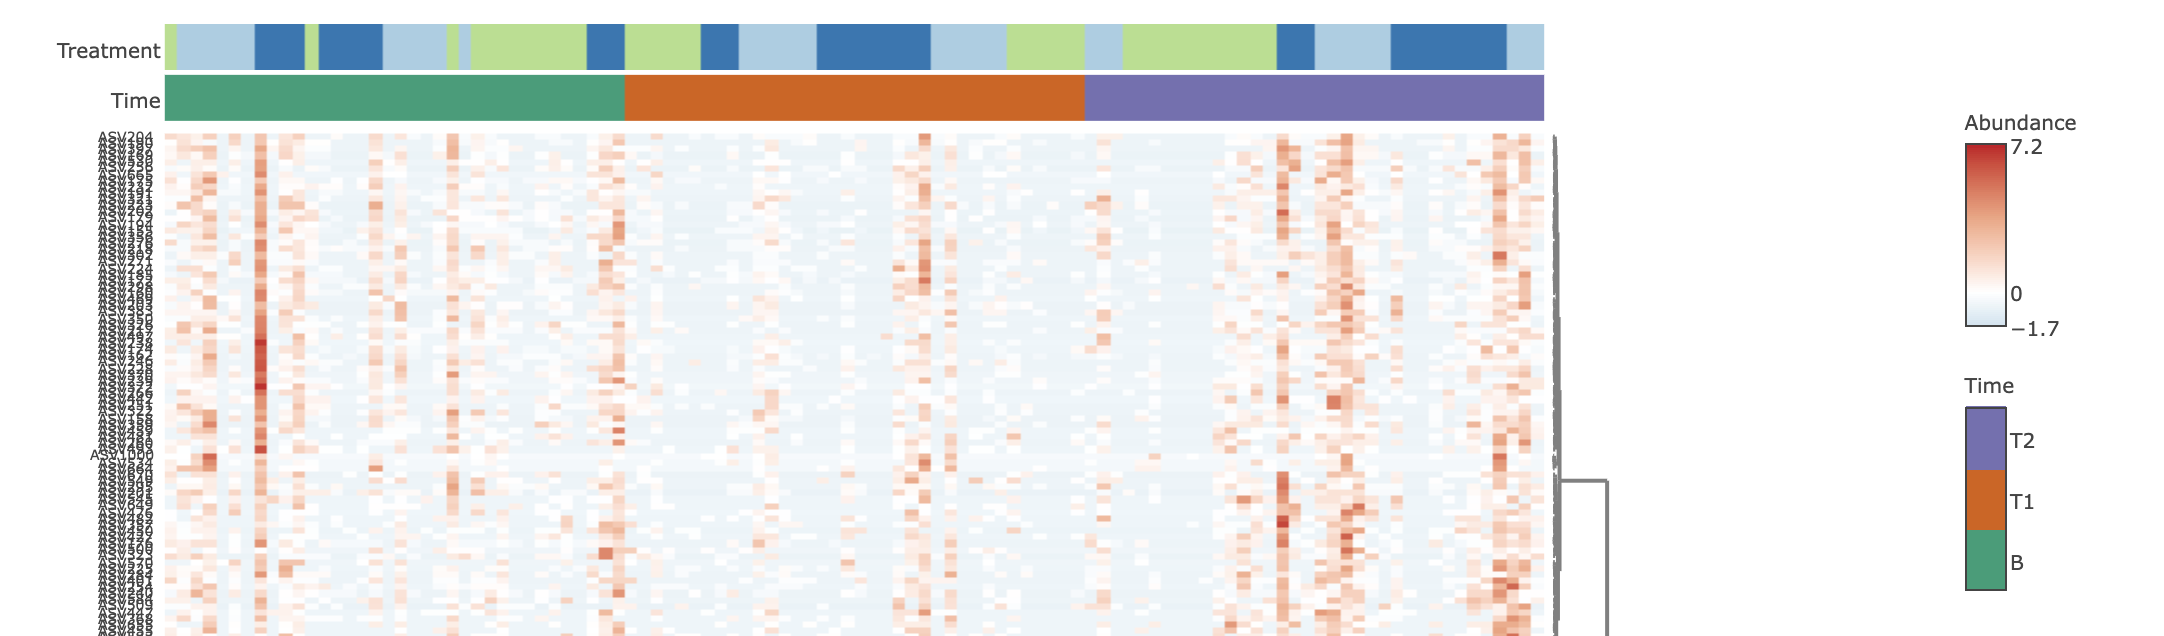
I was wondering if it’s possible to enable the “z-score” option for visualizing a heatmap. with rRNA 16S gene metabarcoding. Currently, I can only see only the abundance displayed in the figure.
Thanks in advance
Have a nice day.