data_filtered.csv (174.1 KB)
Taxonomy.csv (2.6 MB)
meta_test.txt (424 Bytes)
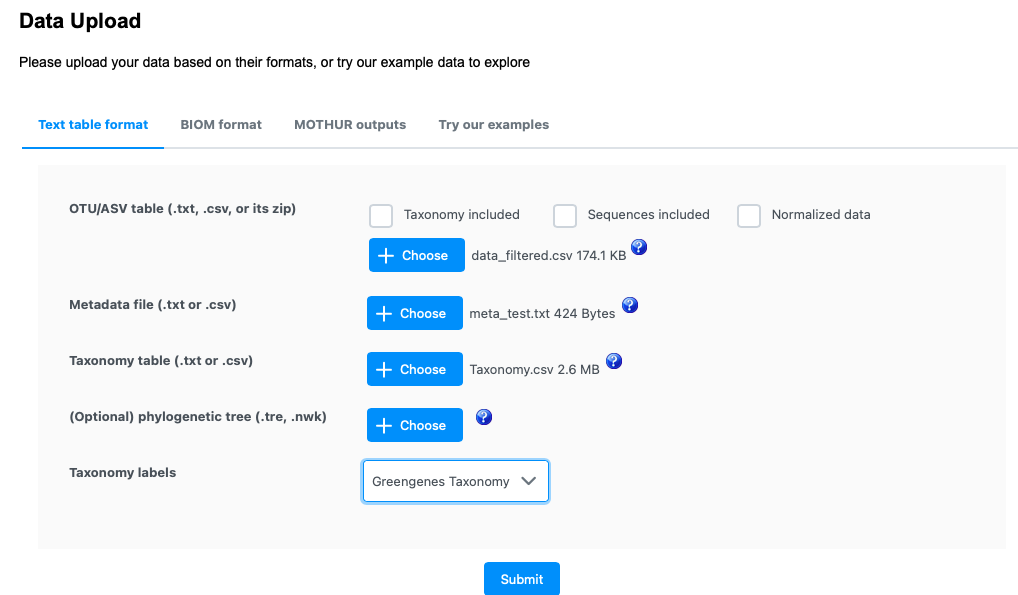
HI,The procedures:
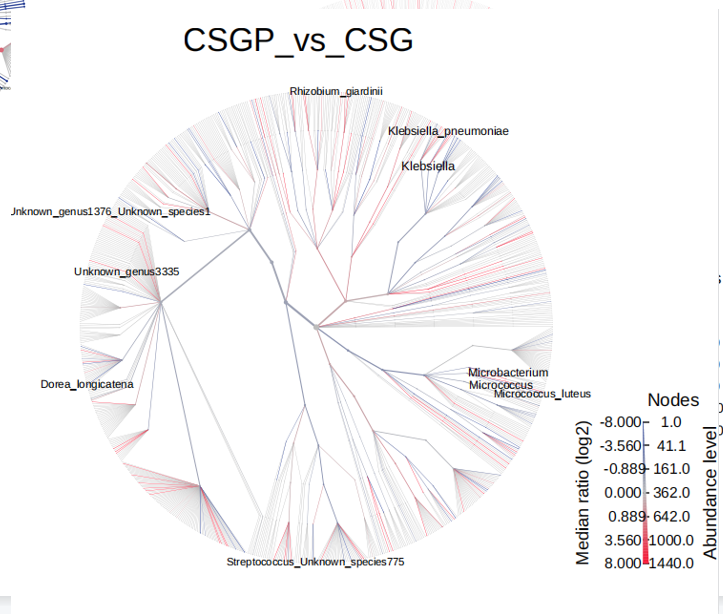
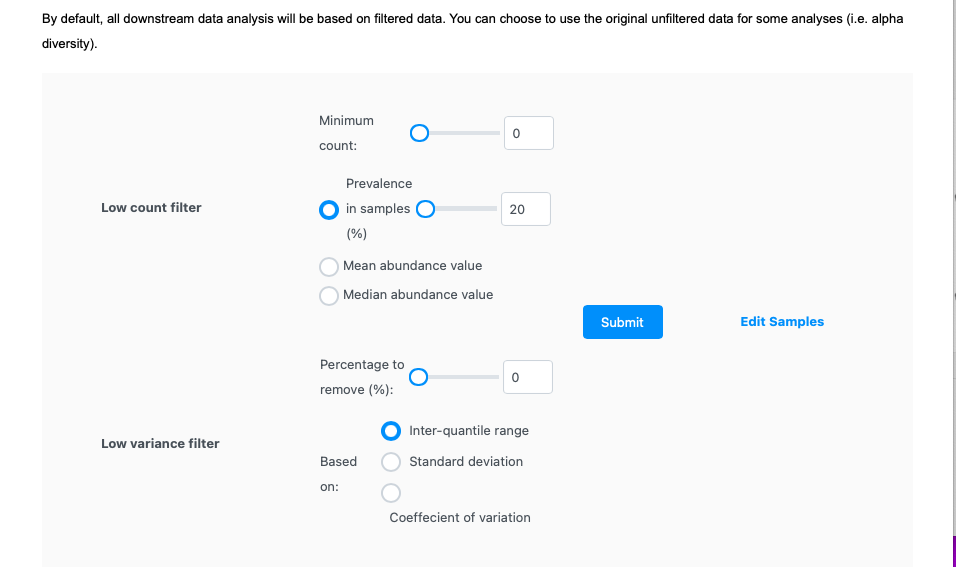
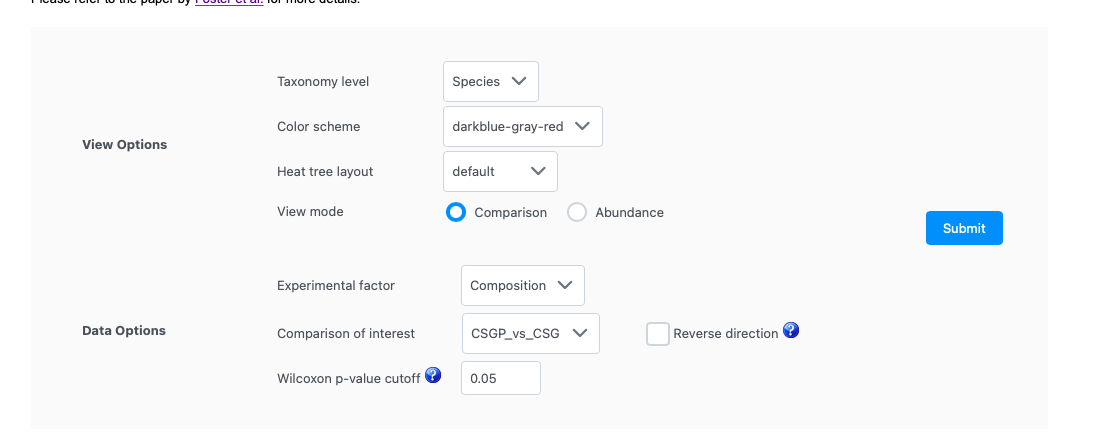
MicrobiomeAnalyst 2.0>>Marker Data Profiling>>choose above three data(nothing included& greengenes taxonomy)>>no filter>>no normalize>>heat tree analysis
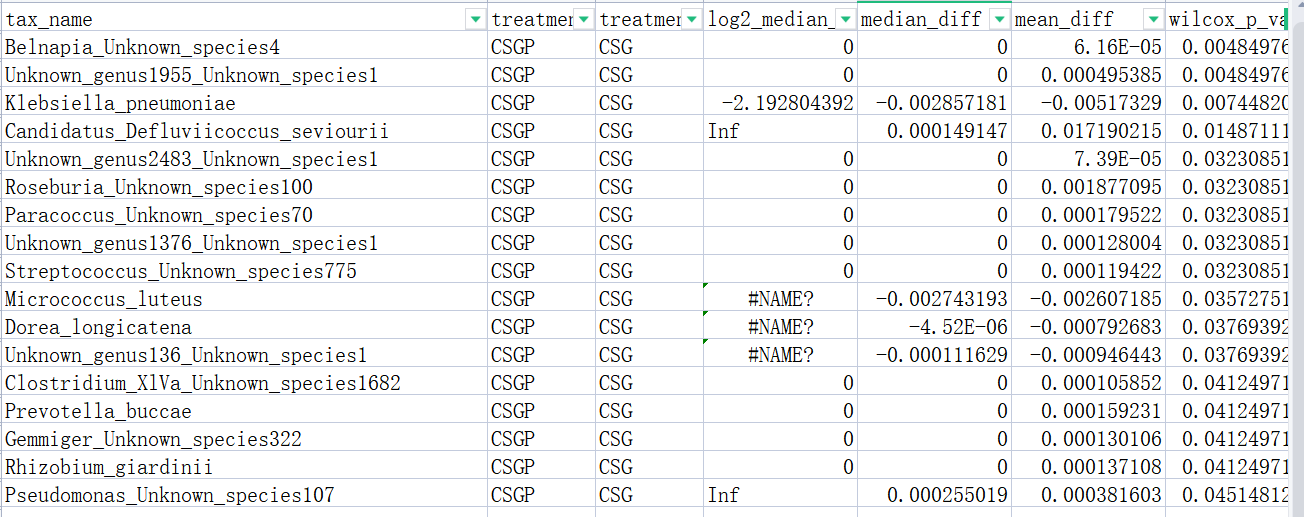
Q: The bacterial species displayed in the images is less than that in the table, which the p-values< 0.05.Can you help me check the reason?

Hello, I have checked your data, it seems caused by the taxonomy labels, a lot of which cannot be mapped properly. Could you please make sure it was annotated by GreenGenes? Usually, it should look like:
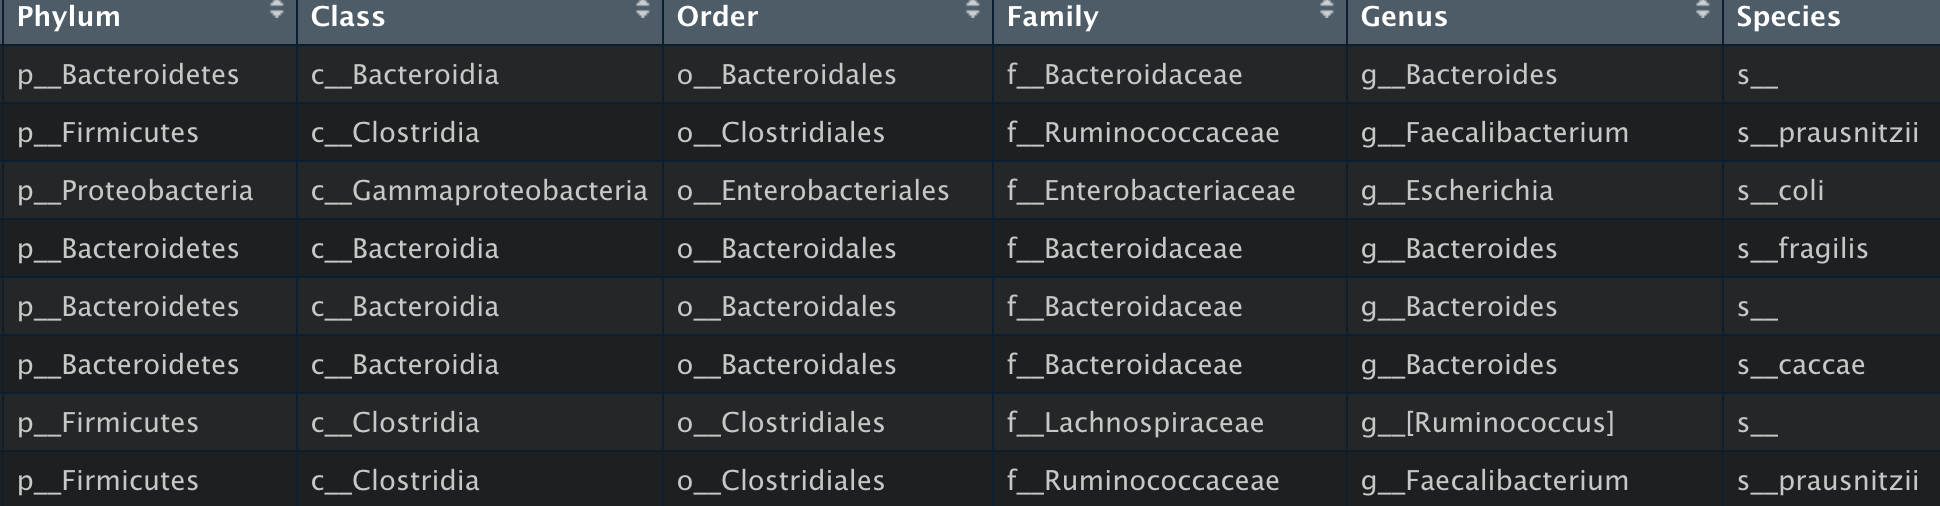
As the problem was from an inner build function of a R package(metacoder), you can firstly confirm the taxonomy labels and let us know if it works and if need more action.
This topic was automatically closed after 11 hours. New replies are no longer allowed.