Hello,
Thanks very much for this awesome tool, MicrobiomeAnalyst!
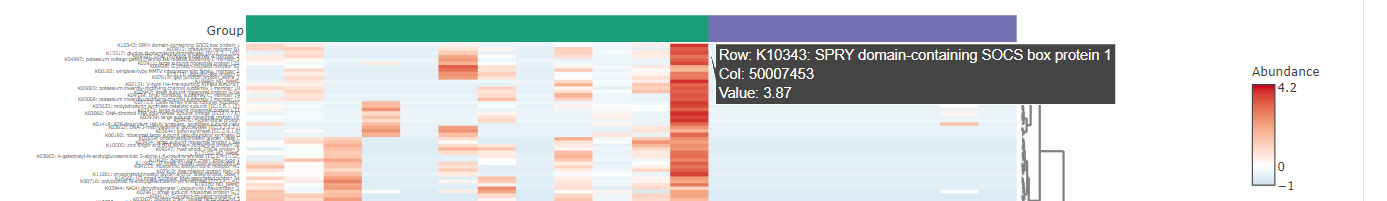
I would like to clarify the unit of abundance from Clustering Heatmap Visualization of Shotgun Data Profiling and how it is calculated.
My submitted gene abundance file contains already normalized abundance. The abundance values’ unit is copies per million, they were not normalized and no data was filtered out on MicrobiomeAnalyst. As you can see from the attached image, the range of abundance is between -1 and 4.2. I thought it was log values but when I calculated log values, the values were different (e.g. 3.87 is K10343 abundance value of 50007453 from the image, but it is 3.45 when I calculated.)
I tried to find the information about it on Resources page but I couldn’t find it and it seems like the guide for Shotgun Data Profiling is outdated. I would appreciate your answer. Thank you!