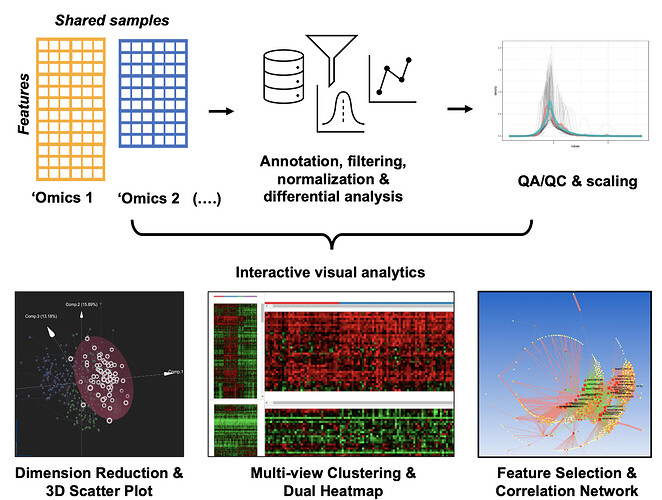
OmicsAnalyst was designed to provide a data/model-driven platform for multi-omics integration (for knowledge / network-driven integration, please refer to our OmicsNet platform). It contains three visual analytics modules:
- Common patterns: employing different multivariate dimensionality reduction methods to view samples and features in a 3D interactive scatter plot.
- Clustering: Coupling density-based clustering with dual-heatmap viewer to compare expression patterns of two omics datasets.
- Correlations: 2D/3D network viewer to visualize correlations and associations between features within and across omics layers.
In addition. OmicsAnalyst offers comprehensive data processing and QA/QC prior to three main visual analytics.
A graphical summary of the main features is given below
