Hi ExpressAnalyst Team,
I’m using your tool to create a volcano plot, but I’m having trouble with the way the plot is displayed.
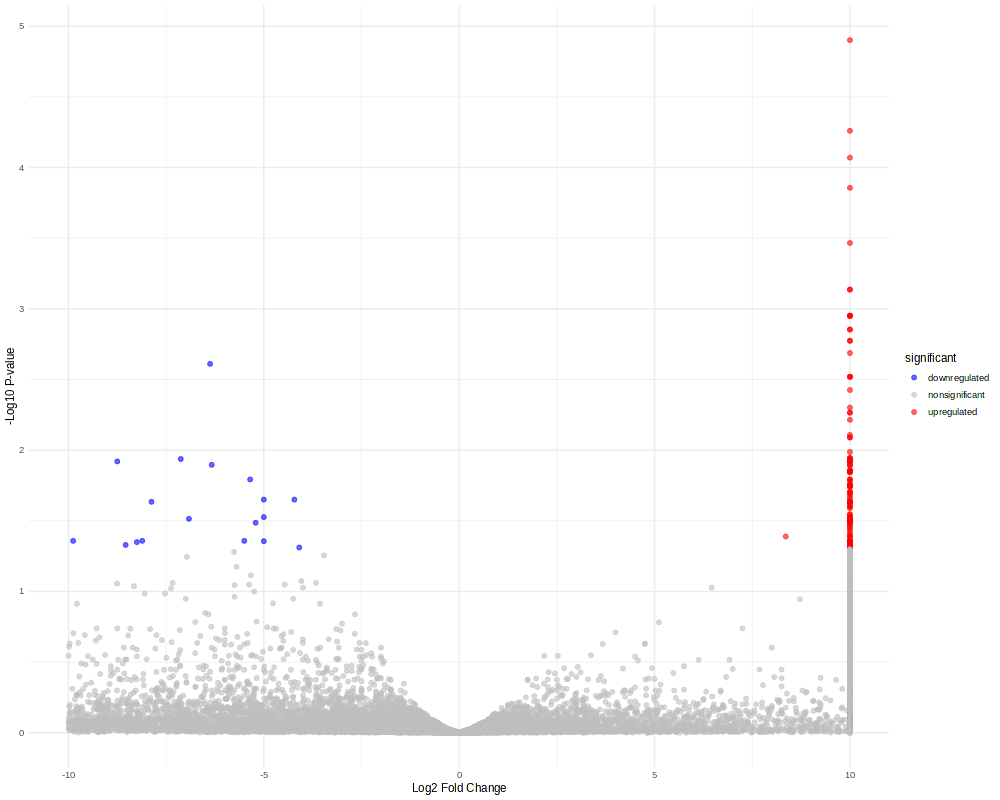
The plot window only shows a small part of the x-axis (Log2 Fold Change). Because of this, I can’t see genes that have very high fold changes – they’re outside the visible area. For example, highly upregulated genes (Log2 FC > 10) are cut off and not shown in the plot, even though they are in the data.
It looks like the window is zoomed in too much or the axis is limited. I attached a screenshot to show the problem.
Is there a way to:
Adjust or zoom out the x-axis?
Show the full range of fold changes?
Export a full version of the plot?
Thanks in advance for your help!
Best,