Hello all,
As stated in the subject line, even when using the example data, there are discrepancies between the numerical values displayed in the web page analysis results and those in the downloaded CSV data.
The issue can be reproduced using the following steps:
-
On the “Upload a gene expression table” screen, select “Mouse liver and Metadata” from “Try Example” and click “Submit”.
-
On the “Data Quality Check” screen, do nothing and select “Proceed”.
-
For “Missing value in metadata”, select “OK”.
-
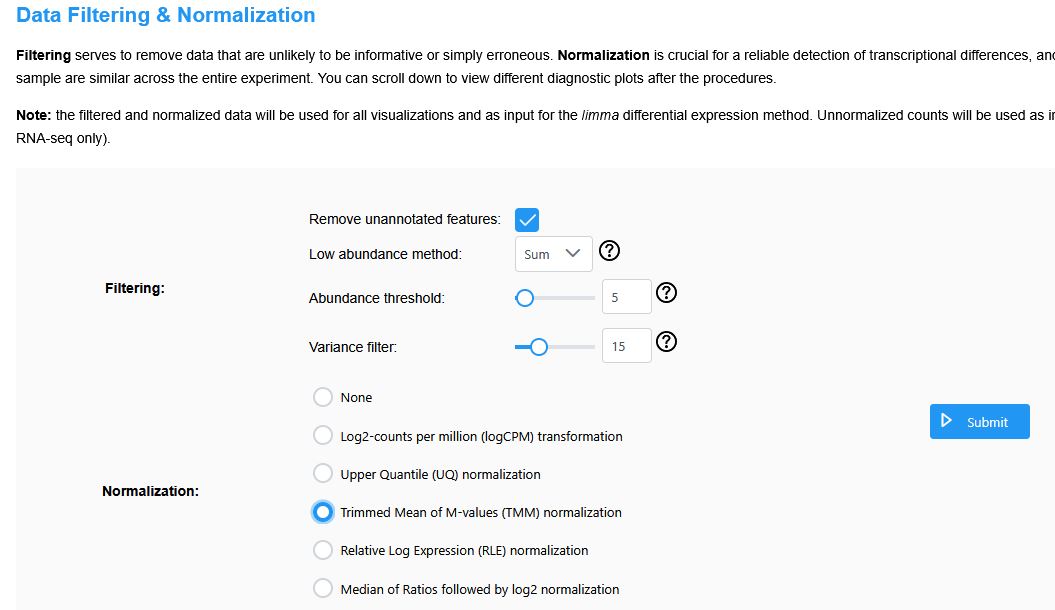
In “Data Filtering and Normalization,” set the Filtering parameters as shown in the figure, select TMM for Normalization, and click “Submit”.
-
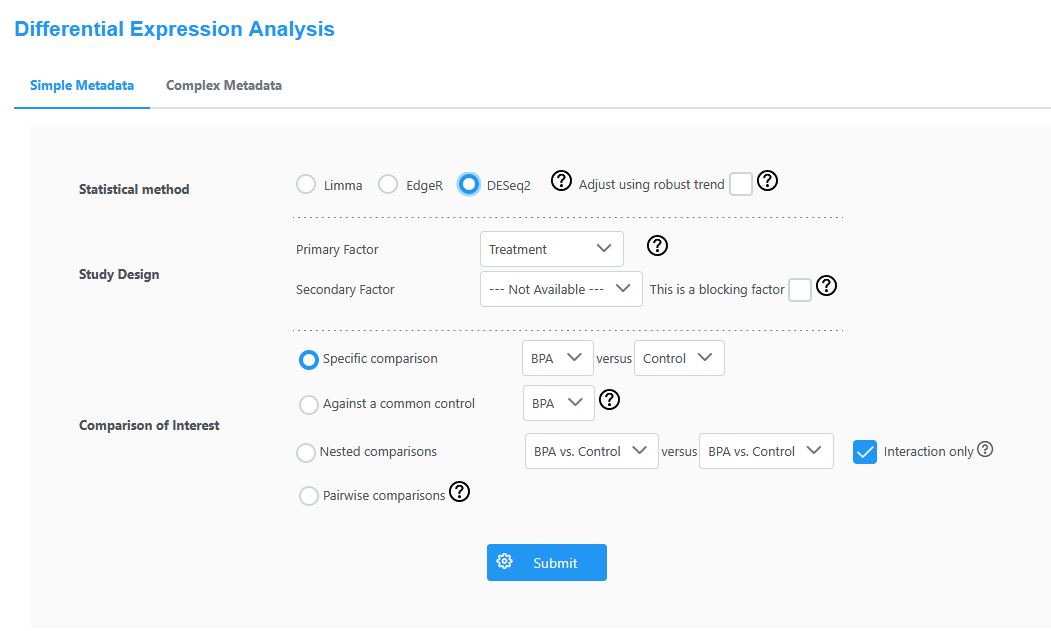
In “Differential Expression Analysis”, select DESeq2 for Statistical method. For “Study Design”, choose Treatment only under “Primary Factor”. Under “Comparison of Interest”, select “Specific comparison” as shown on the screen and click “Submit”.
-
Click “Proceed” to view the results.
Here, on the webpage,
Cfdp1’s logFC is displayed as -1.5013 and Lpp’s logFC as 0.68775.
However, in the downloaded CSV file,
Cfdp1’s logFC is 0.68775 and Lpp’s logFC is -1.5013, reversed.
Upon closer inspection, these two rows are swapped.
Additionally, on the webpage,
Copz2’s logFC is -1.1236 and Gabpb2’s logFC is 0.70598.
However, in the downloaded CSV file,
Copz2’s logFC is 0.70598 and Gabpb2 is -1.1236.
Here too, the entire row’s values are swapped.
We would be grateful if you could deal with the issue.
Thank you for reporting the issue! While I am trying to fix the issue, I noticed that in both examples you provided the p-values are the same. Is that your experience in your own data analysis as well?
Regards,
Guangyan
We found discrepancies while analyzing our data. We can share it with you, provided the data remains confidential.
I have made changes to fix the issue, please give a try and let me know if it fixed it. If not, please send your dataset to my email: guangyan.zhou@xialab.ca
Thanks,
Guangyan
Unfortunately, it appears the issue has not yet been resolved.
As you pointed out, swapping occurs within rows sharing the same adjusted p-value.
Furthermore, there appears to be a consistent pattern: in the CSV data, when adjusted p-values are identical, the unadjusted (original) p-values with smaller values appear first, followed by those with larger values.
In the analysis of Mouse liver RNAseq data that I created and presented, Gm20594 (row 2) and Pfdn5 (row 3) both have an adjusted p-value of 1.9136E-65, yet no row swapping occurs. Upon closer inspection, the webpage shows Gm20594’s original p-value as 4.2165999999999994E-69 and Pfdn5’s original p-value as 4.3662999999999996E-69. Since Gm20594’s original p-value was smaller than Pfdn5’s, it appears no row swapping occurred.

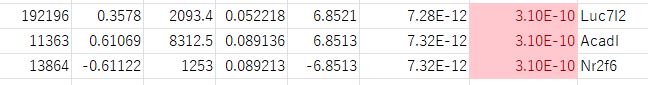
This becomes clear when examining the three rows with identical adjusted p-values: Luc7l2 (row 308), Acadl (row 309), and Nr2f6 (row 310) all share an adjusted p-value of 3.1043E-10. Looking at their original p-values: Luc7l2 is 7.3192E-12, Acadl is 7.3186E-12, and Nr2f6 is 7.2767E-12. When sorted by original p-value from smallest to largest, the order is Nr2f6 < Acadl < Luc7l2. In the downloaded CSV data, the rows are swapped in this order. That is, the rows for Nr2f6 and Luc7l2 are swapped, but Acadl is consistent between the webpage and the CSV data.
It appears that either an unintended sort is occurring in the CSV data (based on the original p-values), or the sort that should be performed on the webpage data is not being done.
We will send you our data via private email. We hope it will be helpful.
Thank you, Dr. Zhou!
The previously reported discrepancies have been resolved.
We appreciate your prompt attention to the issue.