Hello,
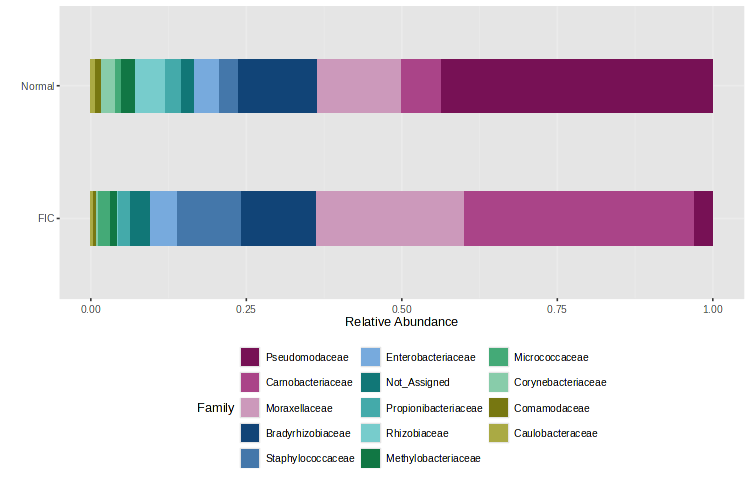
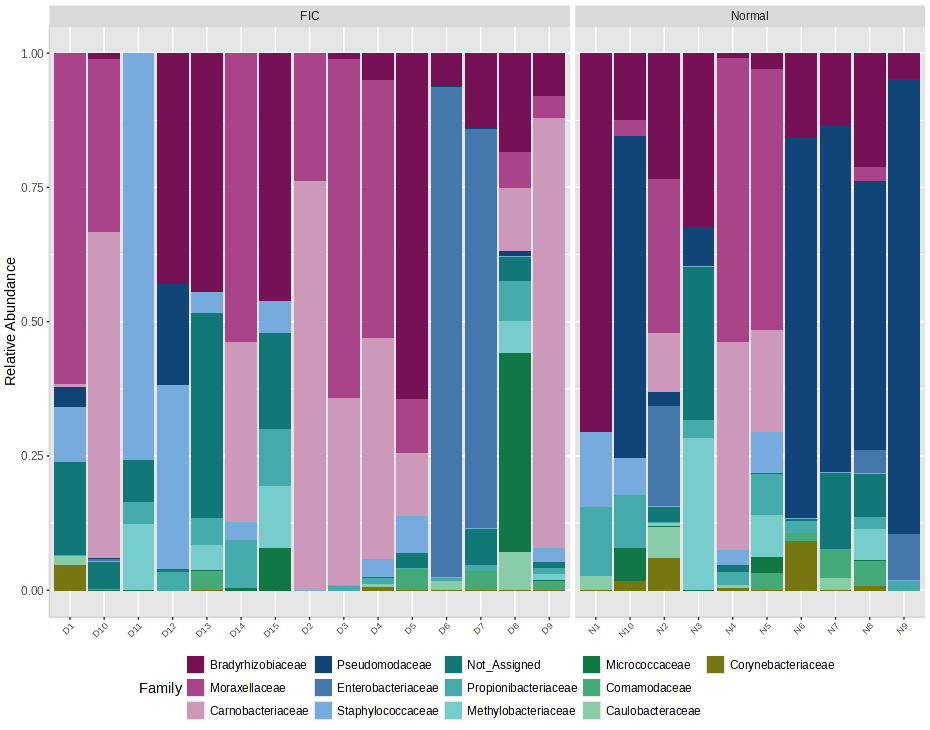
Why does the number of bacterial species differ between individual and grouped stacked bar presentations, despite using the same sample?
Thanks.
Hello,
Why does the number of bacterial species differ between individual and grouped stacked bar presentations, despite using the same sample?
Thanks.
The grouped stacked bar (top) is based on the mean abundance which is sensitive to strong outliers or absolute high/low values; The stacked bar (bottom) is based on relative abundance which gives proportion (but group mean was computed based on abundance, not proportion)
This topic was automatically closed after 2 days. New replies are no longer allowed.