Hi Xia,
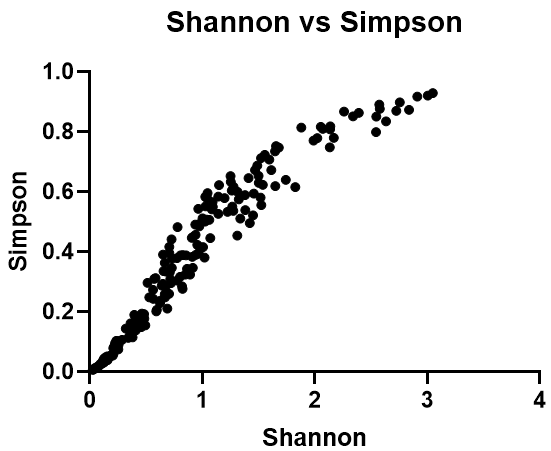
For results table downloaded from Alpha diversity module, I noticed that Shannon and Simpson index values are positively correlated in my data set.

As far as I know higher Simpson index indicates less diversity, so Shannon index should be negatively correlated with Simpson index. I suppose Simpson index output is actually not D but 1-D? Could you confirm this?
Thanks!