I have a “Group5” column in my metadata. It has 24 different groups. The 24 group is because I made a group of different independent parameters. Unfortunately for some reason that partciular column- Group5 is not picking up.
Control vs disease
sample -3 of them
Age - 4 of them (3year,4, 4.5, 5)
I want to compare Control _sample_age VS Diseased_sample_age. Total group =24 in single column. I have column with 16 group showing up in the microbiomeanalystbut no this one .
I am currently facing an issue with my microbiome analysis, specifically related to the “Group6” column in my metadata. The dataset contains 24 different groups in this column, and I am attempting to compare “Control_sample_age” versus “Diseased_sample_age.” “Group6” column seems to be not picking up as expected.
I have ensured that my metadata is properly formatted, the group labels are correct, and there are no typos. The “Group6” column contains unique identifiers for each sample, and the values are correctly assigned.
I suspect that the number of groups (24) in the column might be causing the issue. Could this be a limiting factor for MicrobiomeAnalyst, or am I overlooking something in the analysis process?
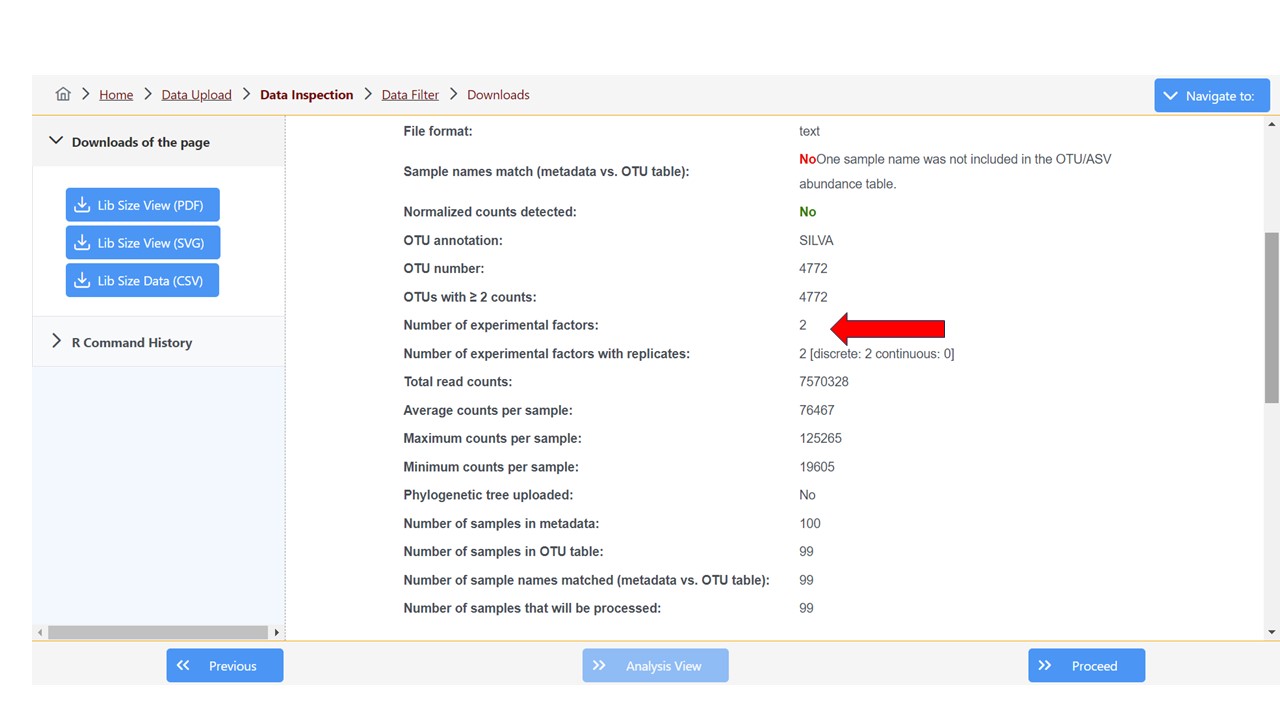
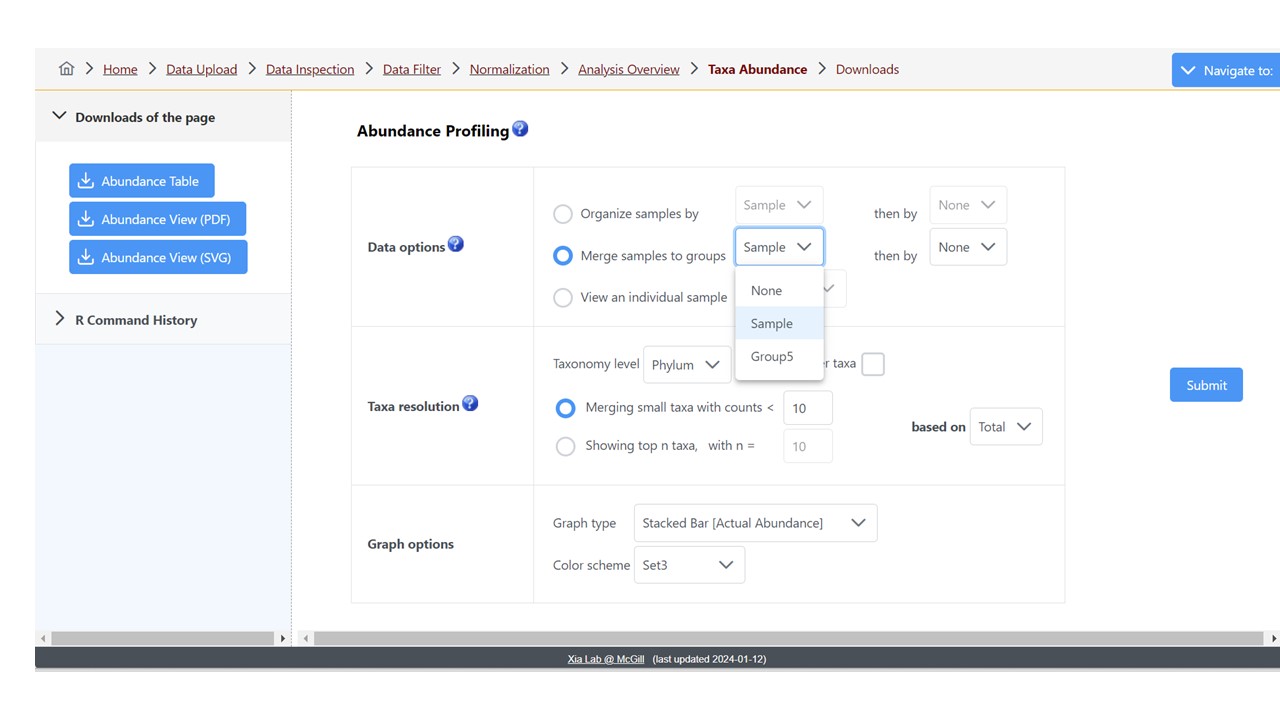
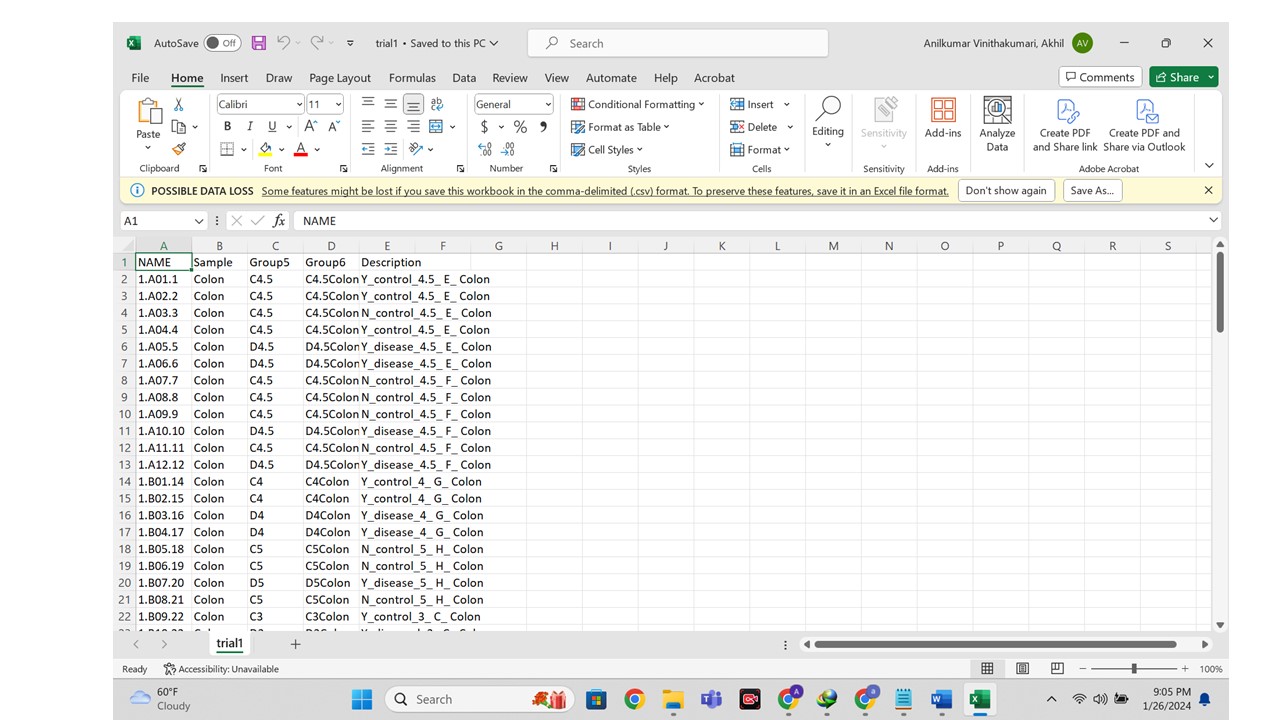
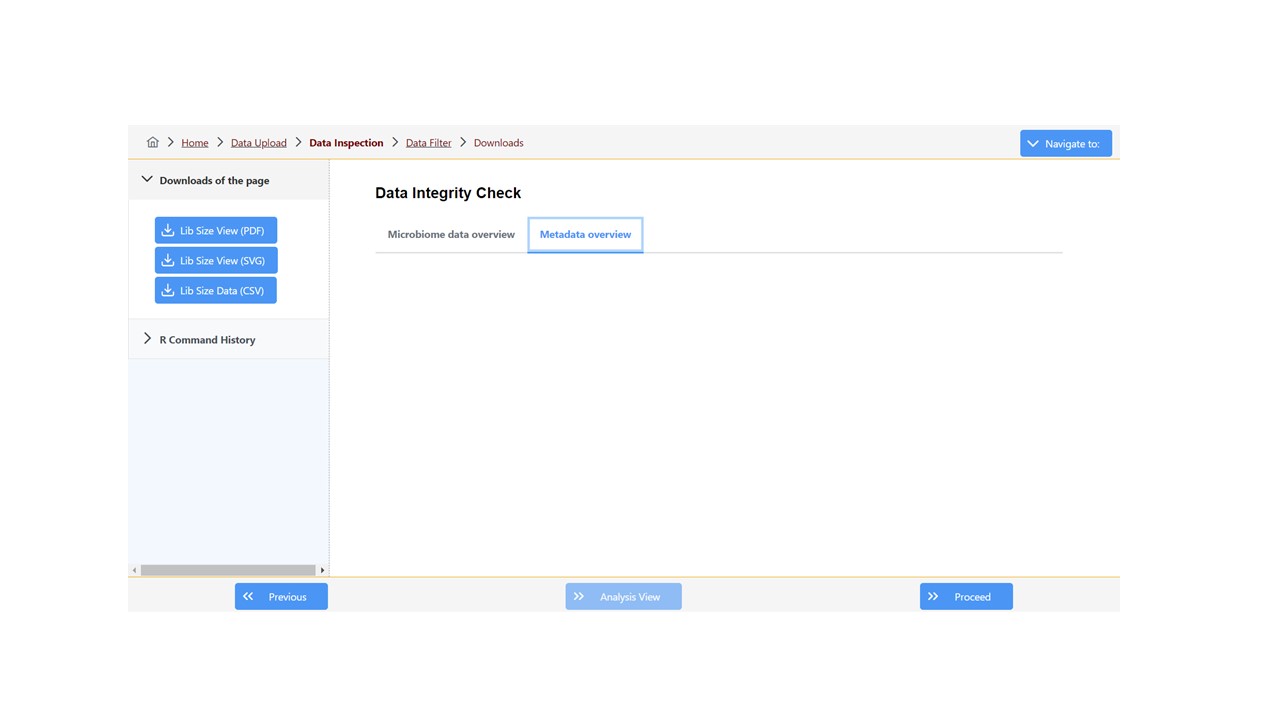
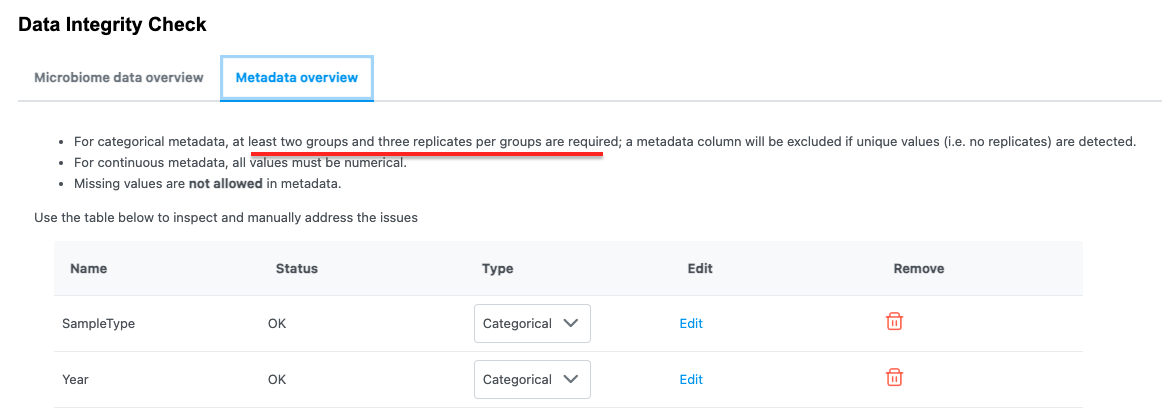
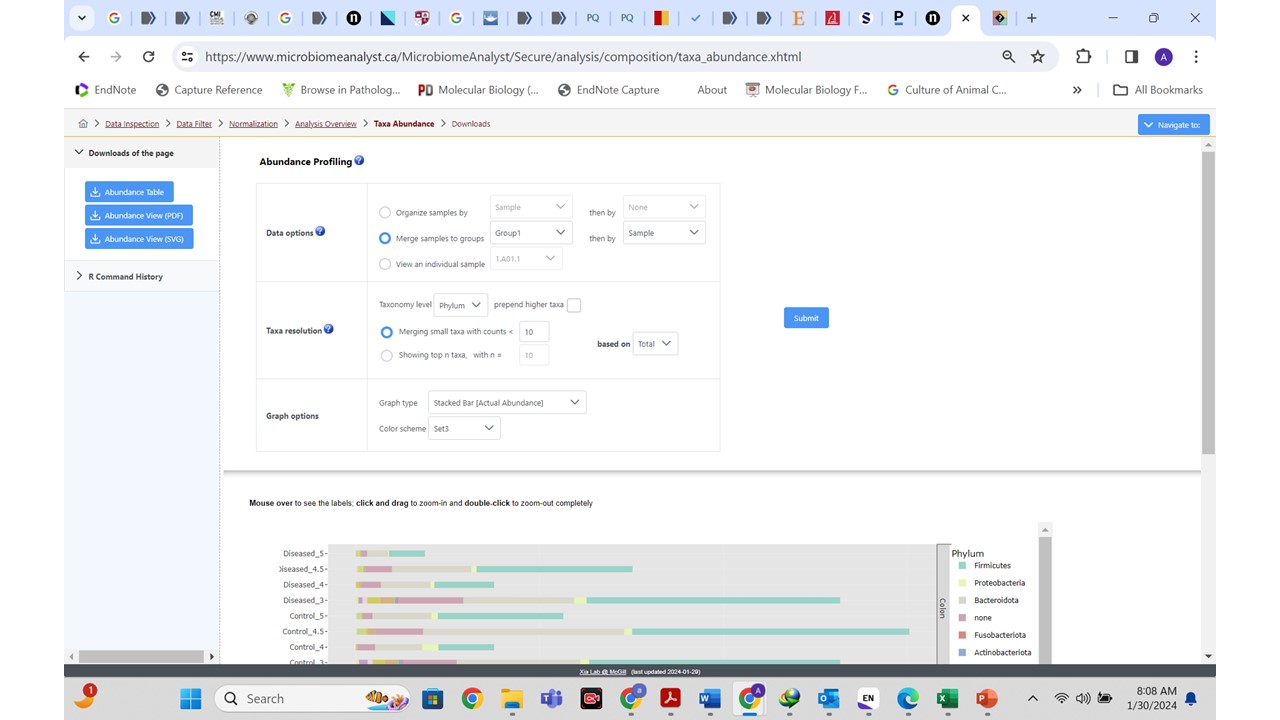
I’ve included my data file, and the taxonomy table is incorporated into the OTU table. The dataset was generated using the Silva database. Picture 1 demonstrates that, during data inspection in MicrobiomeAnalyst, only 2 experimental factors were detected. This is further supported by Picture 2, which displays only 2 experimental factors as options when determining abundance. In Picture 3, an Excel sheet exhibits 4 experimental factors. Furthermore, as depicted in Picture 4, the option “metadata overview” is not loading during the data integrity check.
I would greatly appreciate any insights, suggestions, or troubleshooting tips from the community. Has anyone encountered a similar issue before, and how did you address it?
As highlighted on that page, the default setting require at least three replicates for each group. So the columns that with less replicates was excluded. This is the reason why only two factors were kept in your data.
Thank you for the response and helping me. This is perfect and makes total sense.
I have two other queries. I really appreciate your time and consideration. In plottoing abundance plot, here is option to “Merge samples to group by - “Experimental factor 1” and then by " Experimental Factor 2”. Is it possible to get the same function in alpha diversity, beta diversity and other anlyses?
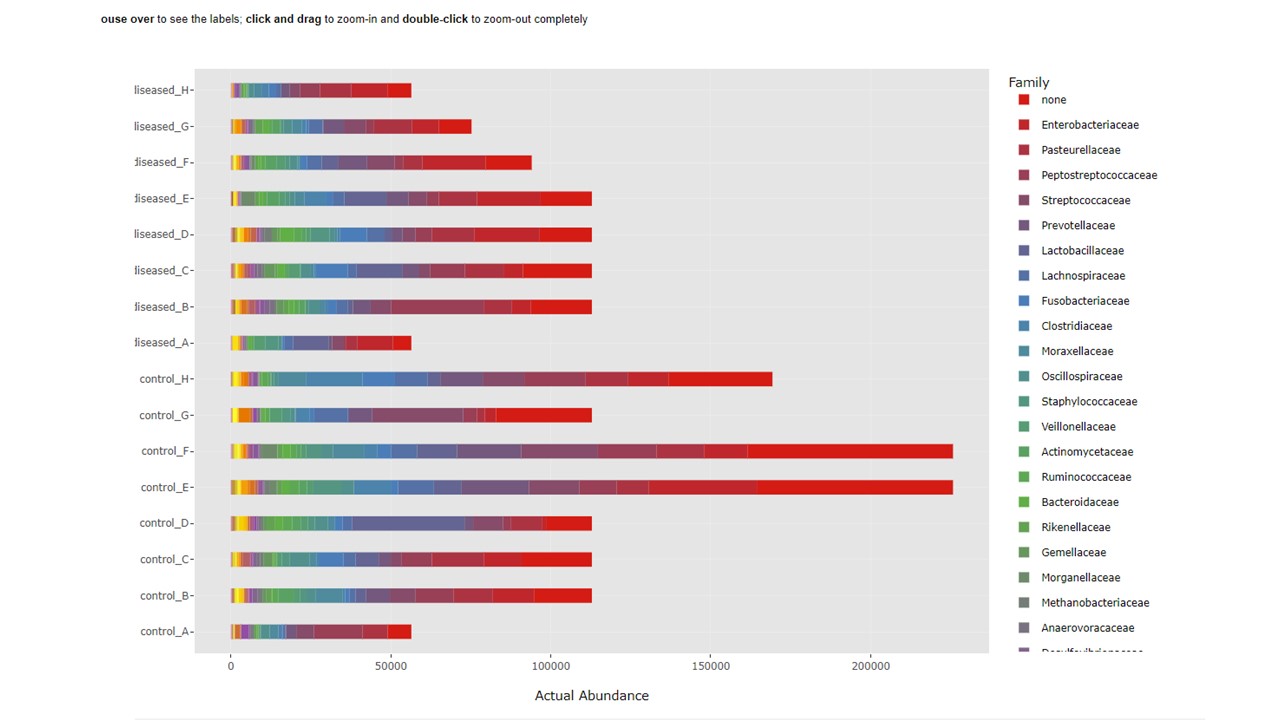
While I was creating abundance plot, we noticed that when analysing sample at Family level, the box plots are hard to differentiate. The colours appear too similar and the line that seprates two family is very hard to see. Is it possible to get contrasting colours or thicken the line that seprates two family genera