In the volcano plot obtained from single gene expression table analysis, how do I extract the list of only the upregulated and downregulated genes? Thanks.
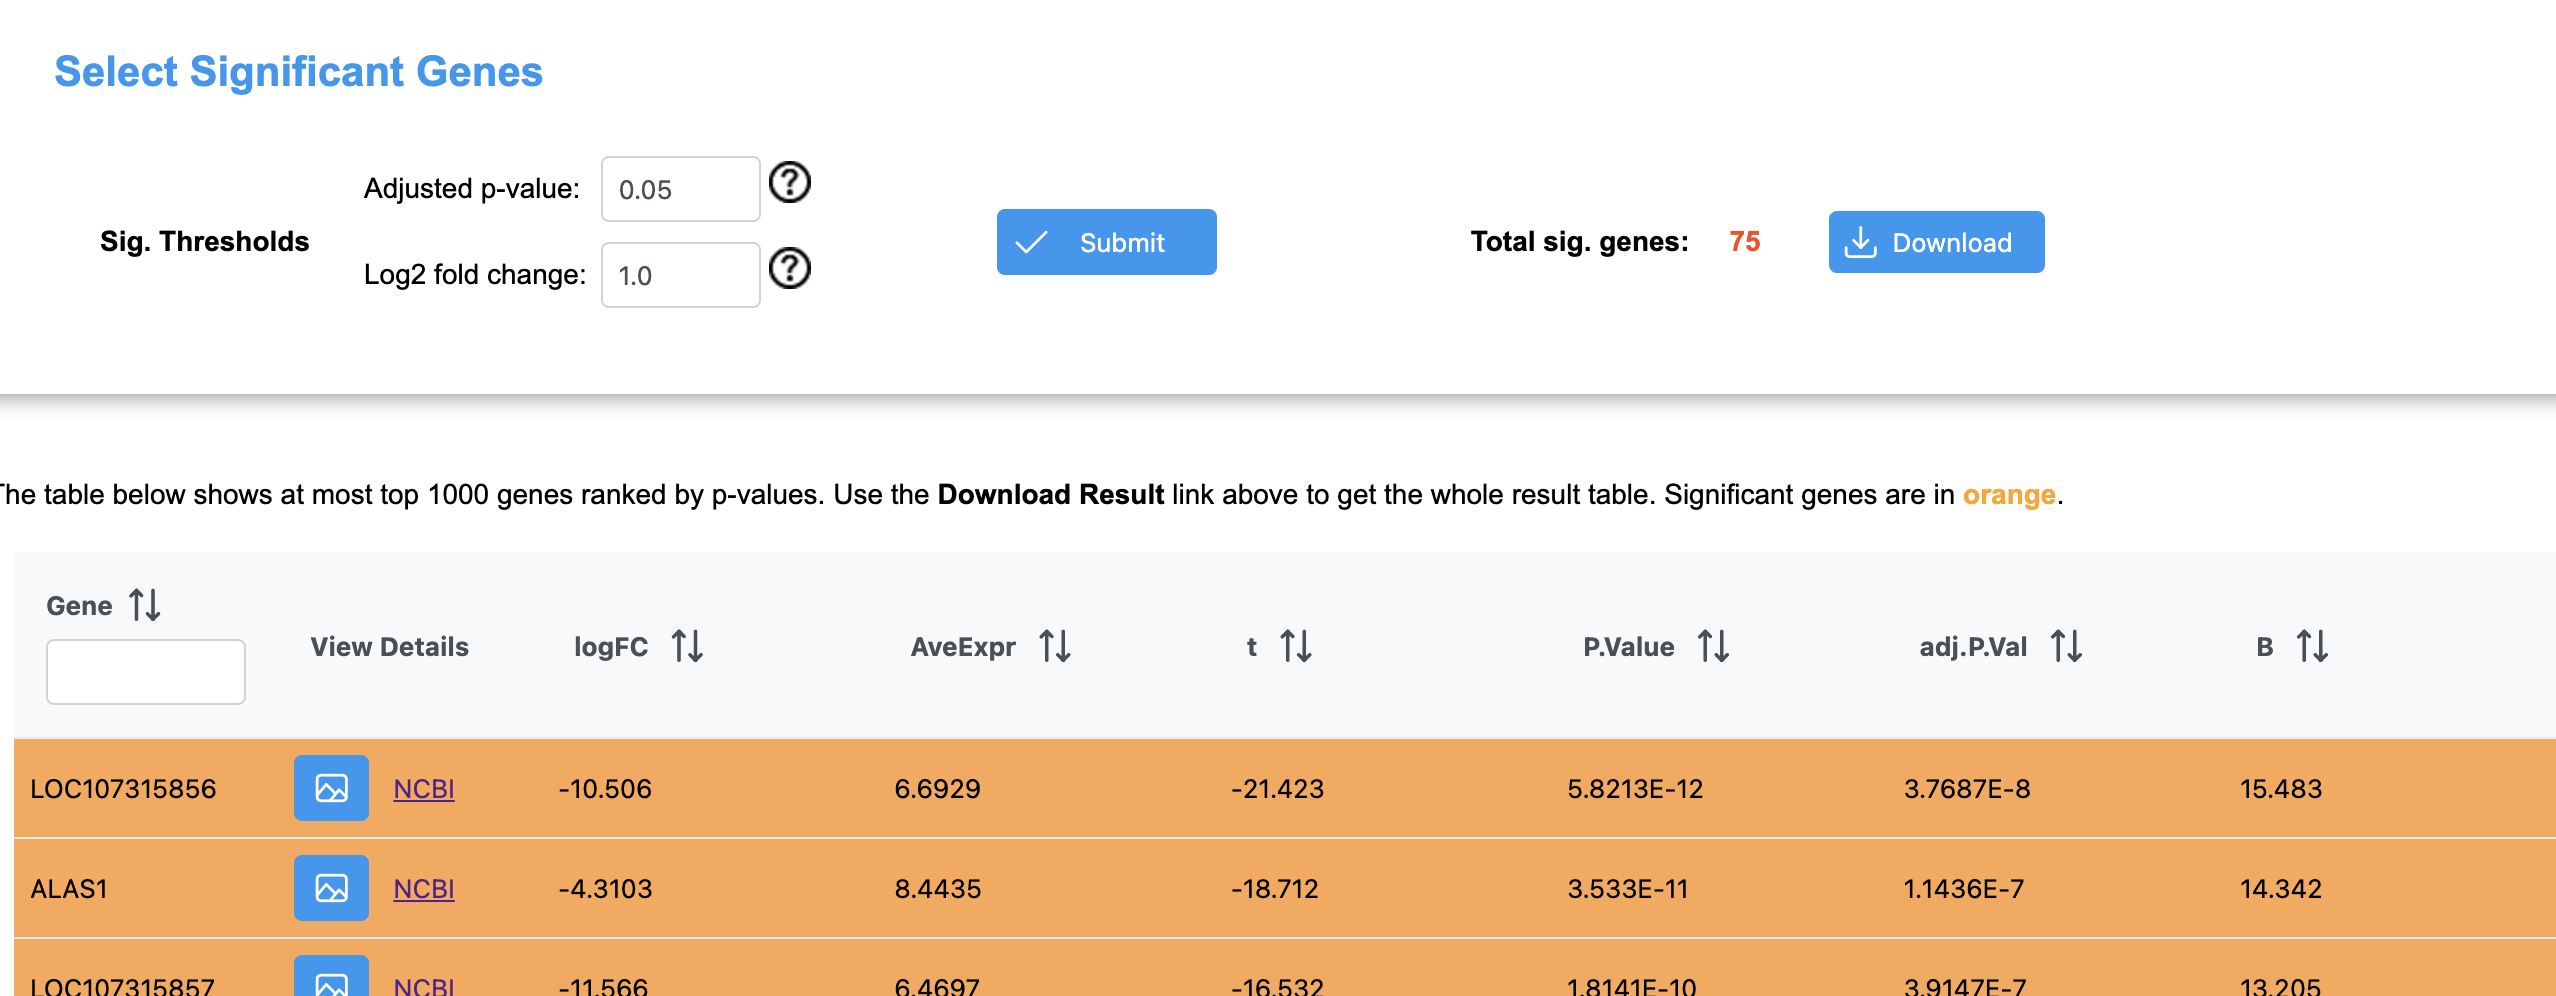
After differential analysis, there is the “Sig. Genes” page. Here, you can adjust the p-value/FC thresholds, select different contrasts (if you have multiple groups in your design), and click ‘Submit’ to update the table. This is the exact table and thresholds that are used for all of the interactive visual analytics features, including the volcano plot. The table can be downloaded on that page (see top right):
1 Like
Thanks, heaps! This was very helpful indeed
1 Like