Dose-response analysis using expressanalyst appears to give incorrect values for the tPOD values (20th gene, max first peak, and 10th percentile).
For example, the 20th gene in the results table is 0.12, but the 20th gene value on the density plot is 0.076.
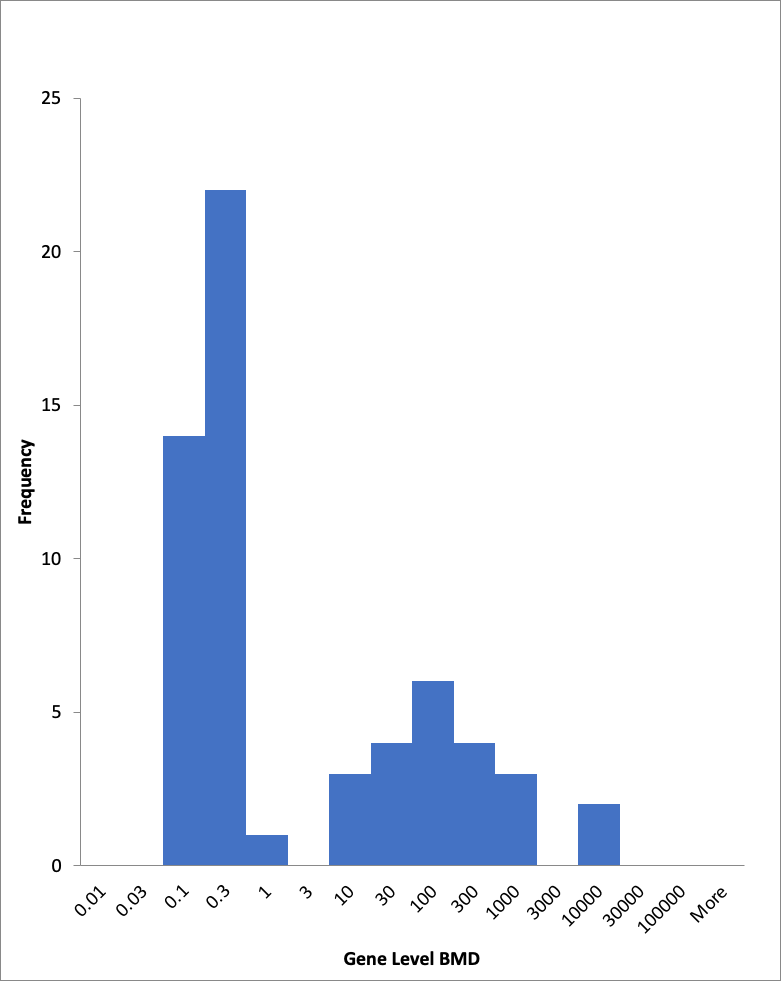
I downloaded the data and made my own histogram from the gene level BMDs (see below). The values given on the density plot in express analyst for this data set are also shown below.