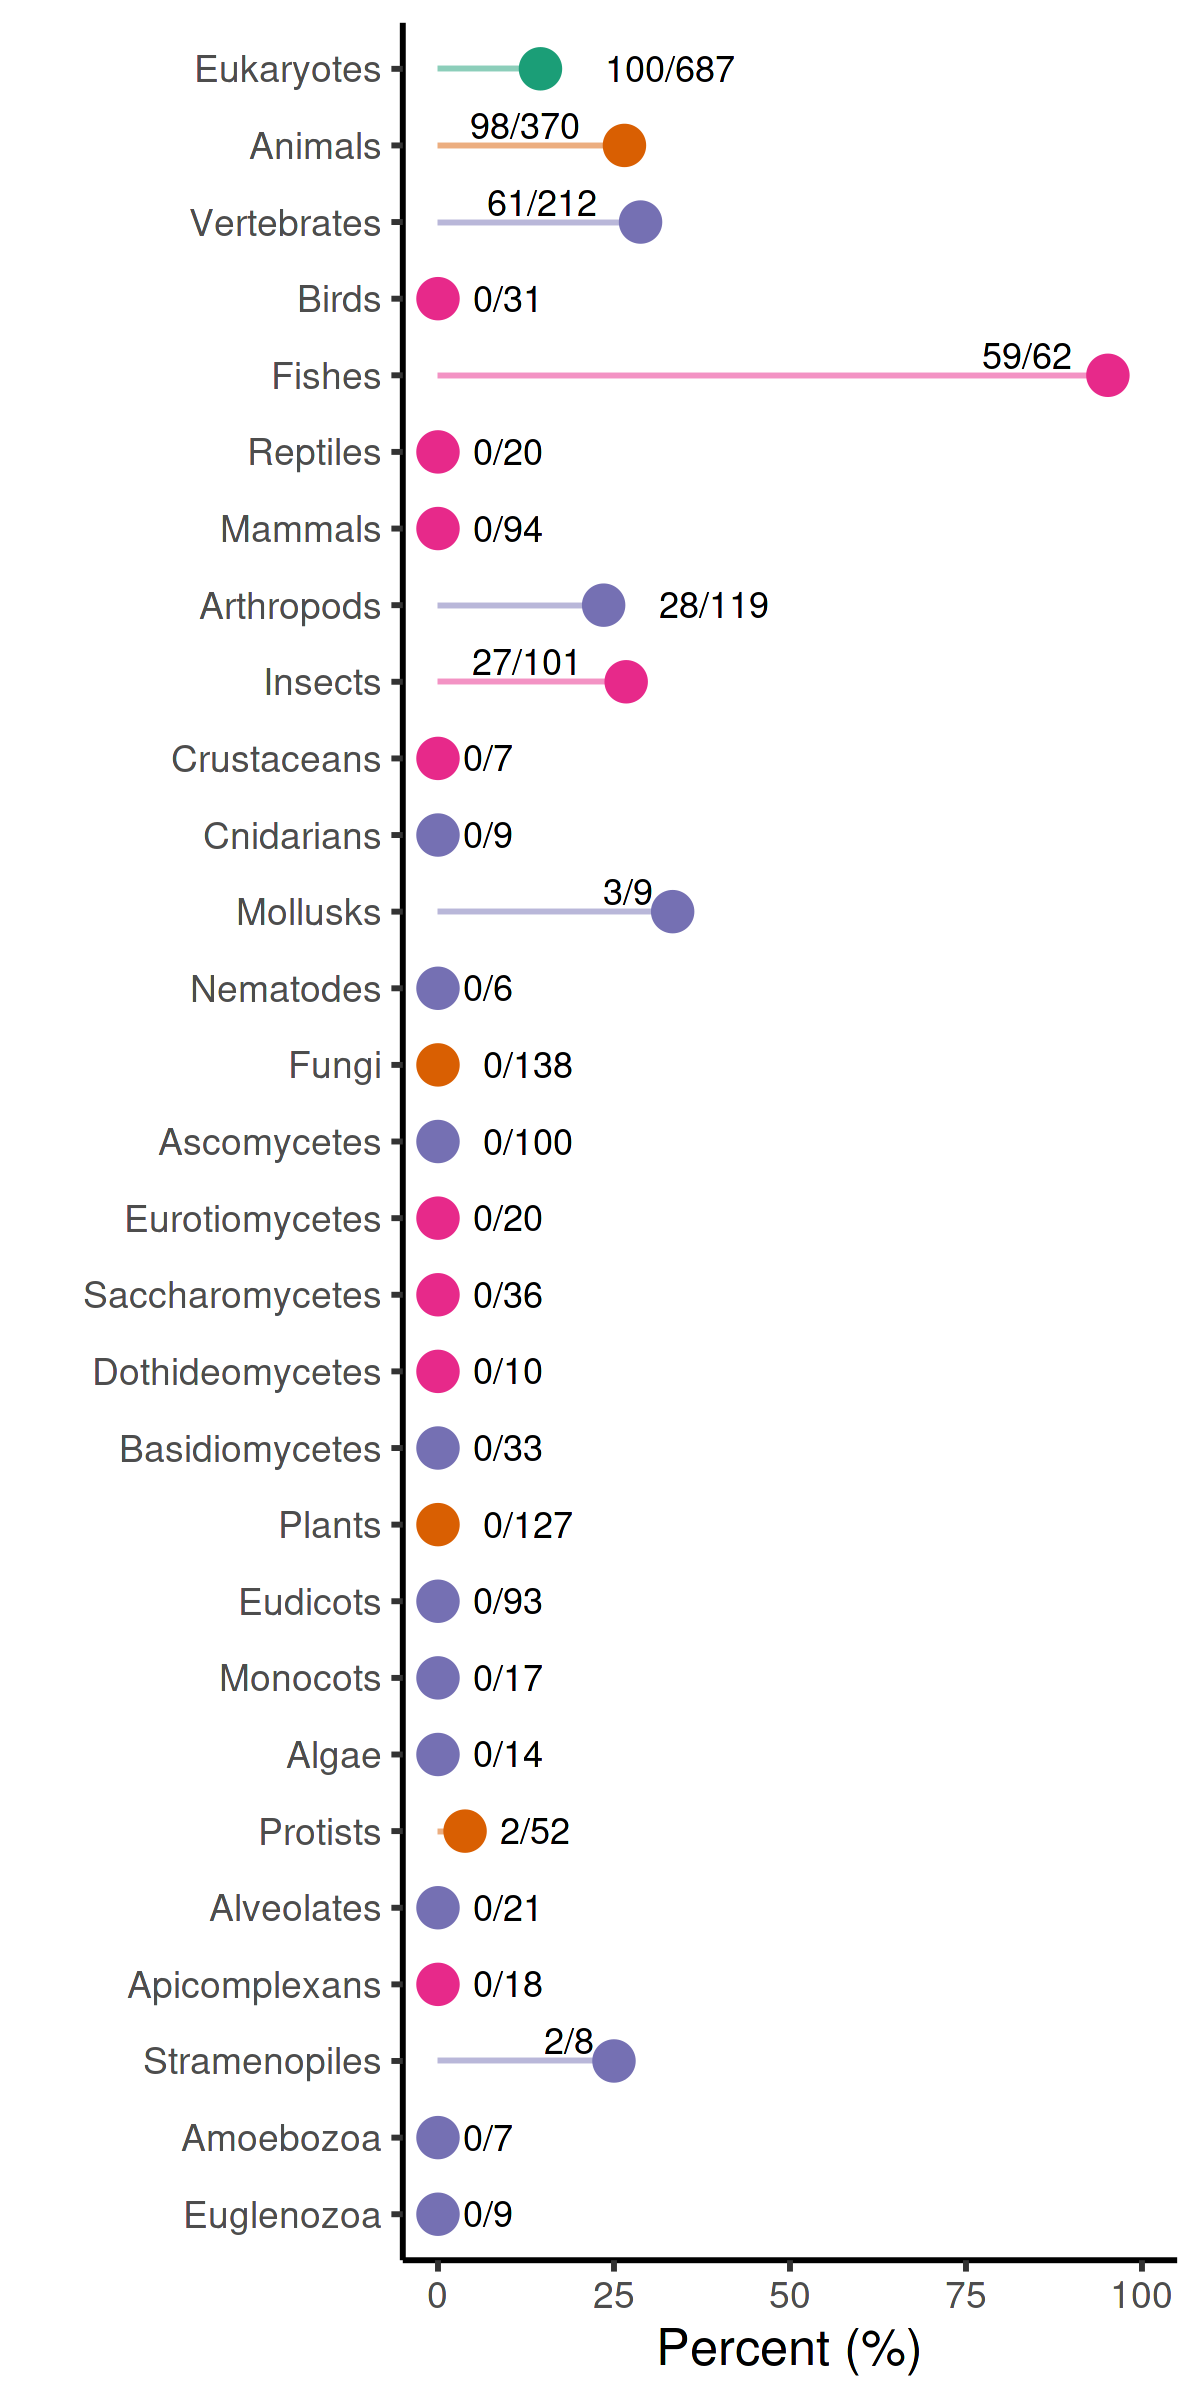
The species hits plot is an intuitive summary of the distribution of a given ortholog across different taxonomic groups. An example output is below - taxonomic groups within the animal kingdom are on the y-axis; the percentage of those species in EcoOmicsDB with a sequence in the ortholog group are on the x-axis.