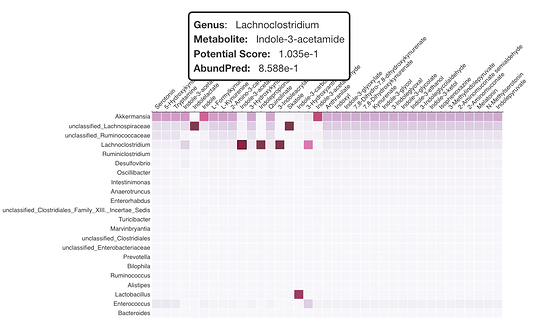
The prediction results are represented as the potential score by default, suggesting the probability of a given taxon producing a specific metabolite. Please refer to the poster on calculating the potential scores
In addition to network presentation, an interactive heatmap is provided to visualize and compare the tryptophan metabolites production potentials across taxa. The rows represent the queried taxa, and the columns are their potential output metabolites.The color gradient from white to dark red indicate the normalized metabolite production potential of each taxon [0, 1].
