Hi, new user to MicrobiomeAnalyst here.
I have managed to generate tax4fun2 data, however, i have had difficulty interepting the data output including the plot (below)
tax4fun2_ko_0 (1).pdf (119.4 KB)
I would like to plot the changes in specific metabolic functions over time, with the aim to produce a plot similar to this one
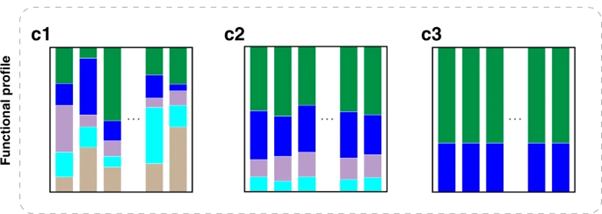
from Deciphering functional redundancy in the human microbiome | Nature Communications
Tax4fun2 produced a table of values for KEGG ortholog genes as well as KEGG pathways, although i do not understand what these values refer to or how i can convert them into a plot as shown earlier.
below are the tables produced by tax4fun2
pathwayprof_tax4fun2 (2).csv (60.4 KB)
functionalprof_tax4fun2 (1).csv (398.5 KB)
any help is very much appreciated ![]()