Helllo,
I was using expressanalyst tool get ridgeplots for my rna-seq data. however the output option is only svg file which gets very long and dosen’t open in in photoshop or any editing tool even if it opens on a browser some of the bigger labels are cut and you can’t see it in full. so i wanted to ask if it is possible to get a single figure for all significant terms in any other file format?
Hi, thanks for letting us know, we will fix the download format to make the SVG editable.
In the meantime, you can manually fix the svg file. The issue is that there are some enclosing div tags around the svg tags. If you remove them and save the file, you can open it with photo editing tools (I used Inkscape).
Open the svg file in a text editor, then delete everything before and after the svg tags (svg highlighted in green, things to remove noted in red, these screenshots are from the top and bottom of the file:

After saving, you should be able to open with any image editing software.
Hello, thanks for the quick reply.
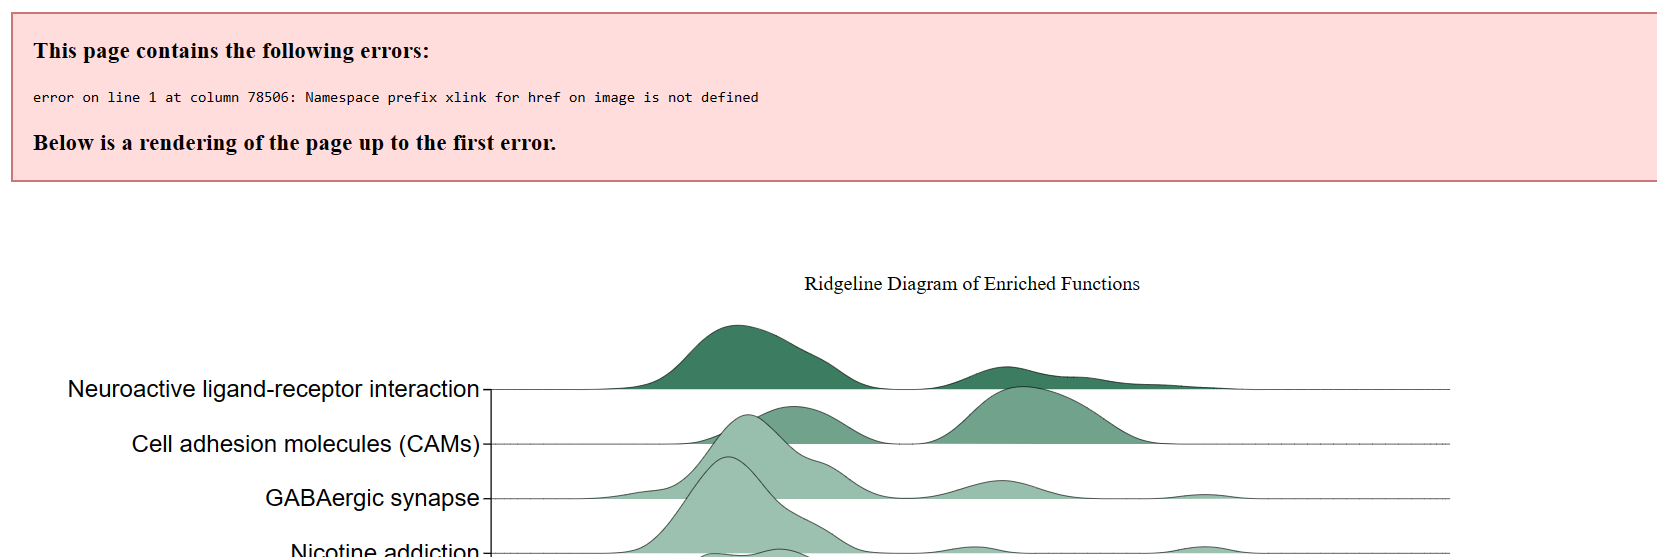
I removed the red highlighted tags but this did not fix things for me. the file is still not opening in any photo editor and i got a new error and the plot seems to be changed as well.
Can you attach the file? I will see if I can open it.
BTW - I have not tried photoshop. This is typically not good for editing SVG. Tools like Adobe Illustrator and Inkscape (free and open source!) are specifically designed to manipulate SVG.
I also get that red error bar when I open the HTML file, but it doesn’t exist inside Inkscape. It is just complaining that some link ID isn’t there, probably it was in the div tags that were deleted. My actual graph isn’t changed, it just has this message at the top when I open in a browser.
Hello Krutuj,
Can you try downloading the ridgeline plot again and see whether the problem is solved. I have made some changes to the SVG export function.
Guangyan
Hey,
unfortunately since the file is a part of on going work I am unable to attach it but what I meant by the graph changed is the line depictiong 0 fold change and the lines dividing each term which also showed the concentration of genes around the fold change was removed which as you said might have been in the div tags.
I have been using Illustrator for svg files, have not tried inkscape ill give it a try.
Thank you
Hello Guangyan,
I tried plotting the graph again to download but it seems to be stuck at processing. Meanwhile I wanted to ask if plotting and exporting this graph would be possible with your r package?
Thank you
Hey jess,
looks like it worked for me i can now open the svg in inkscape. although now i am unable to replot the figure on express analyst - it gets stuck on processing and then after a while it comes back to the homepage. one more thing the csv file that is downloaded changed the symbols to some other ids is it possible to retain the gene names or maybe convert them back.
Thank you so much.
Hello Krutuj,
My last update broke the ridgeline plotting for gene list, I just fixed it and updated the server.
Guangyan
Thanks Guangyan, it is working now.
This topic was automatically closed after 14 days. New replies are no longer allowed.