Users can create and visualize Weighted Gene Correlation Network Analysis (WGCNA) in ProteoAnalyst. The implementation is based on an automated pipeline – Co-Expression Modules identification Tool (CEMiTool). Please note WGCNA requires relatively larger sample size - at least 40 samples are recommended for robust co-expression network creation.
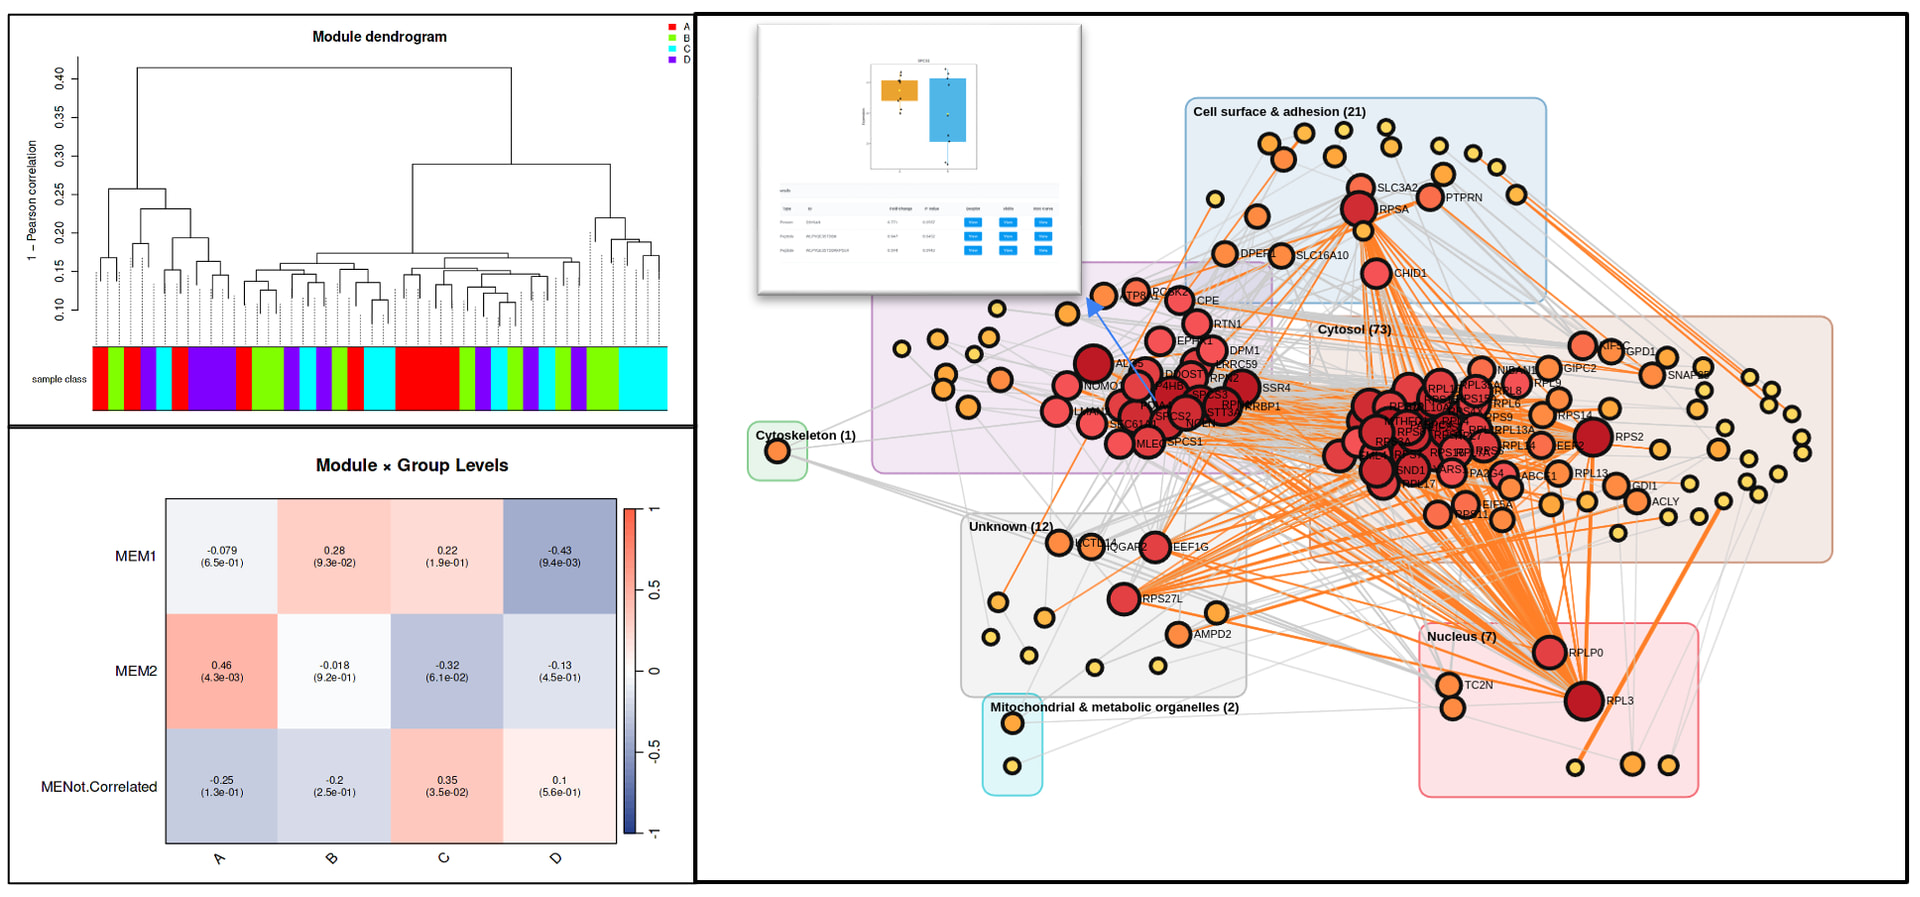
Multiple diagnostic plots and visualizations are provided to facilitate interpretation of co-expression patterns. For instance, the module dendrogram displays hierarchical clustering of samples based on module eigengene expression profiles, while the module-trait heatmap shows correlation strengths between module eigengenes and sample phenotypes.
The co-expression network can overlay with PPI information, as well as to view the cellular compartment of the co-expression modules
See below, edges in orange color indicate the agreement between statistical co-expression and physical interaction (PPI)