The p-value of a module is based solely on network connectivity to give some indication of how significant the connection patterns of a defined module as compared to the rest of the graph. Please refer to this post on module detection algorithms available in OmicsAnalyst).
Let’s call the edges within a module “internal” and the edges connecting the nodes of a module with the rest of the graph “external”. The null hypothesis of the test is that there is no difference between the number of “internal” and “external” connections to a given node in the module. The p-value of a given module is calculated using a Wilcoxon rank-sum test of the “internal” and “external” degrees.
Users should also consider whether the modules are ‘active’ under the experimental conditions, by taking into account the number of seed proteins, their average fold changes, as well as the enriched functions displayed in the Module Explorer table.
Hi, thank you very much for posting this thread.
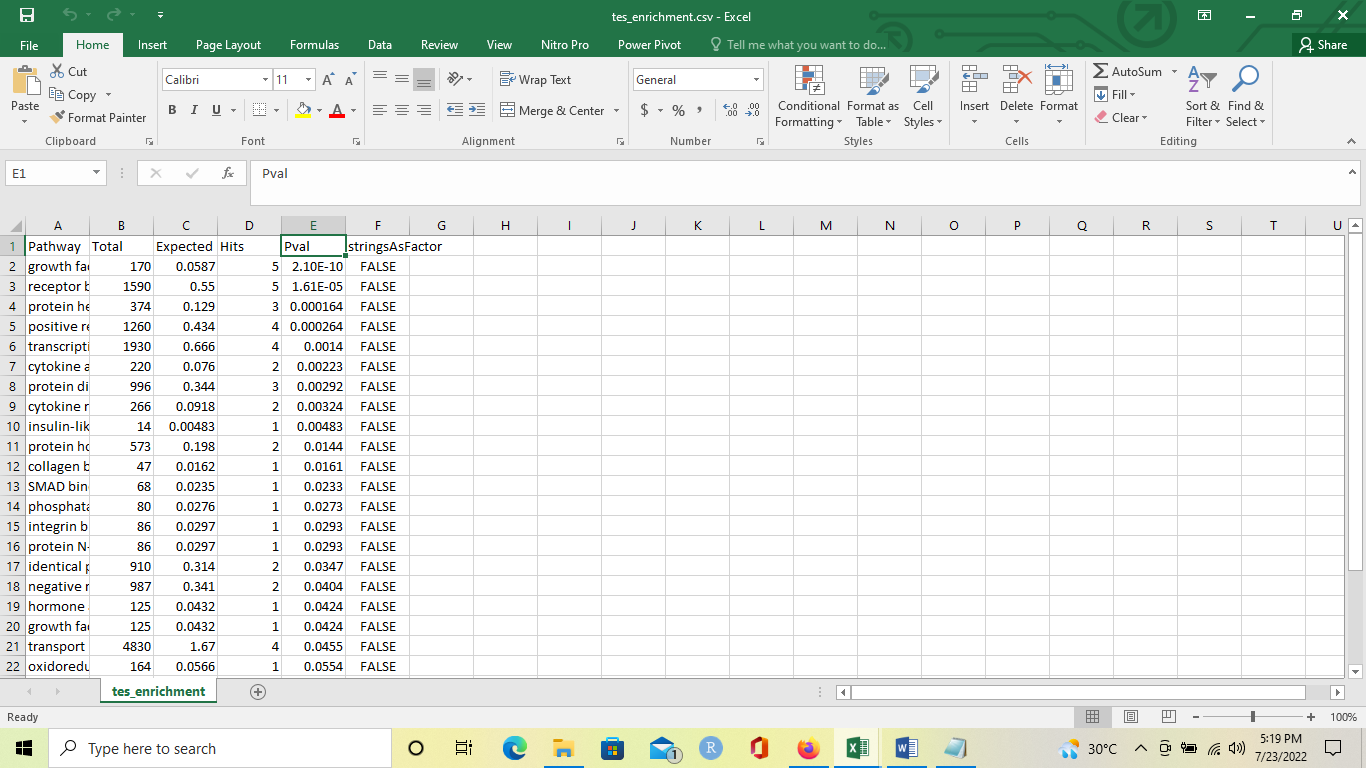
I would like to ask about the adjusted p value (adj.Pval) in enriched function data. What method is implemented to calculate it and how can I include that value in my download since I only see unadjusted p value in .csv file after I download the results (please see the attached screenshot). Thank you in advance for your help.
Best regards,
Frans Dany
Hello Frans,
Sorry for the late response, could you tell me from which website and where in the website did you download this table, so I can add the adjusted p-value. The method used for adjusted p-value is FDR (False discovery rate).
Regards,
Guangyan
Dear Guangyan,
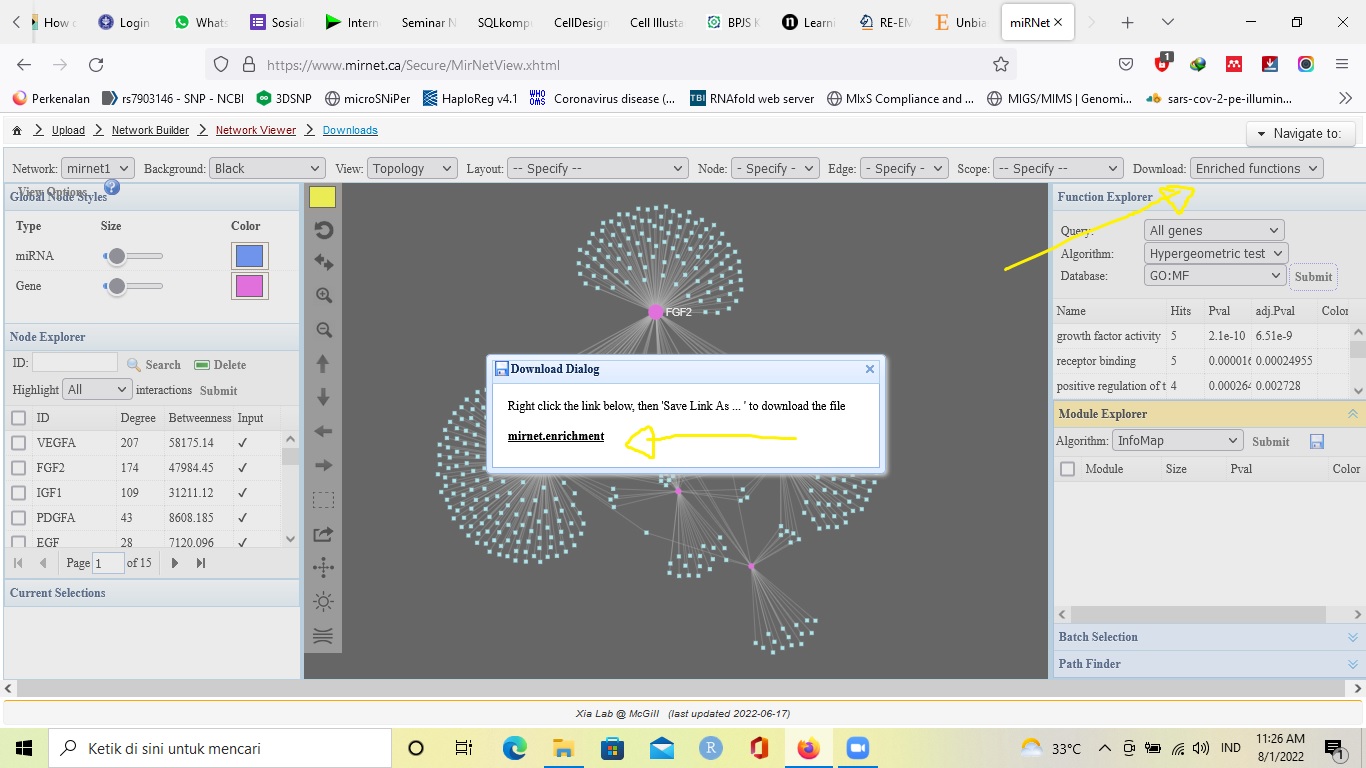
I downloaded it from miRNet database, from the Download menu in the Enrichment Function section. Herewith I attach the sample screenshot from the database. Originally it’s in .csv format then I converted into Excel.
Best regards,
Frans Dany
Thank you for the details. The issue should be fixed now.