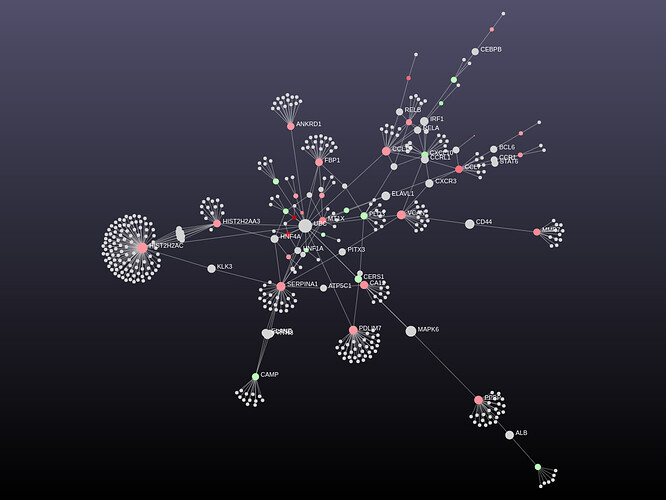
When uploading a list of molecules, an optional second column containing expression value information (such as fold changes). In the network visualization page, display the expression profile by selecting the “Expression” in Styling drop-down menu.
Below is an example of PPI network in expression mode.
*Note: Red - up-regulated genes, Green - down-regulated genes, Grey - predicted interacting partner (no expression profiles)
