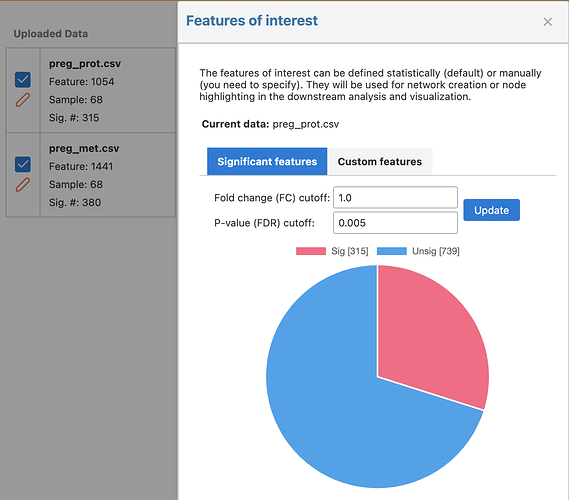
The number of statistically significant features is determined by the method and thresholds set during the data processing step. The results are displayed in the data summary panel on the left side of the page. Clicking the pencil icon beside the summary allows you to change the thresholds to either increase or decrease the number of DEGs. This can be done at any point up to the visual analytics step.
A screenshot of the data panel and DE adjustment dialog (after click the pencil icon) is shown below
