Hi Guangyan,
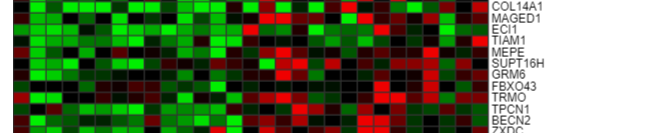
I was able to generate an interesting heatmap, and its gene list through the heatmap function. However, to narrow down the exact features with most significant changes, I need to have the source values that this heatmap is based on. Neither LogFC or normalized counts seemed working.
What values is the heatmap based on? Can we find them in the result downloads?
Thank you very much!