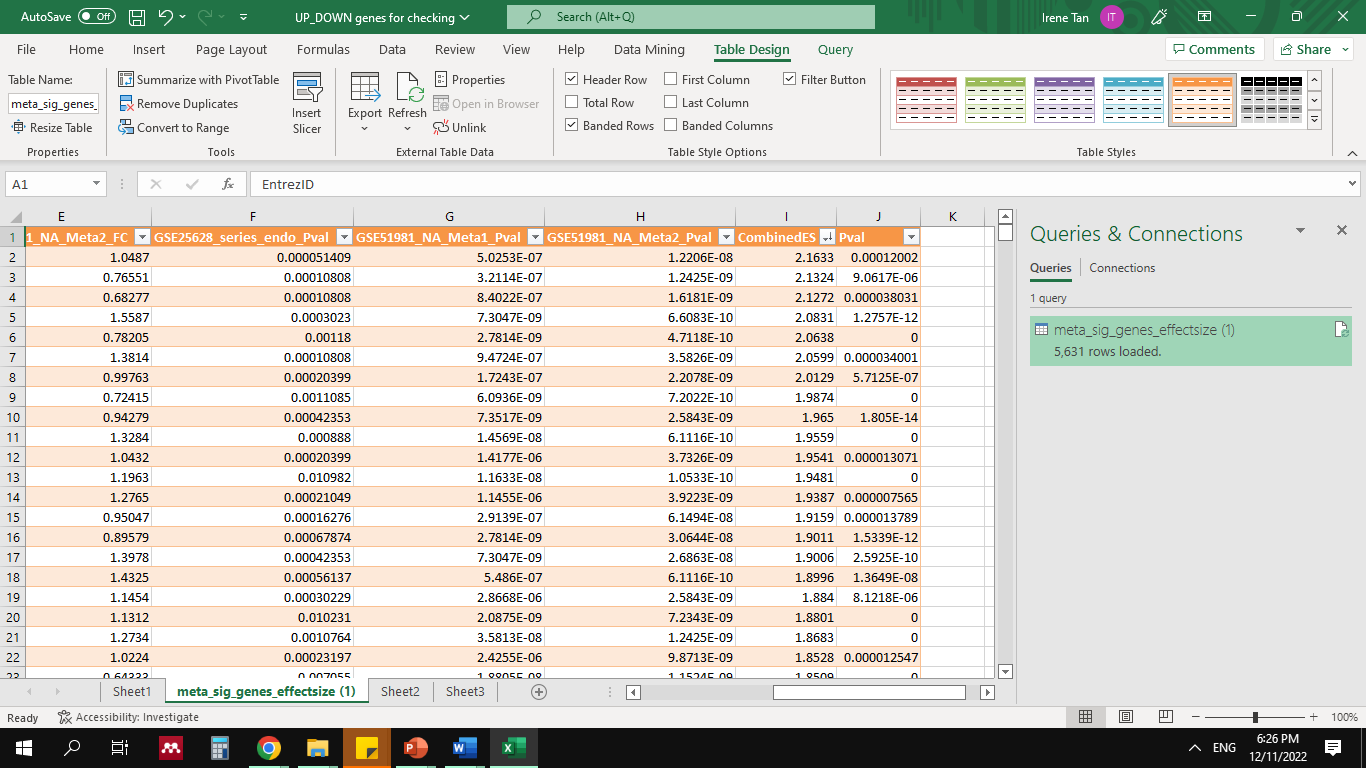
Hi, thanks that the meta-analysis is working again. You fixed it ![]() I was just wondering why in the csv file downloaded at the Gene-level meta-analysis result, the meta_sig_genes_effectsize_csv_file
I was just wondering why in the csv file downloaded at the Gene-level meta-analysis result, the meta_sig_genes_effectsize_csv_file
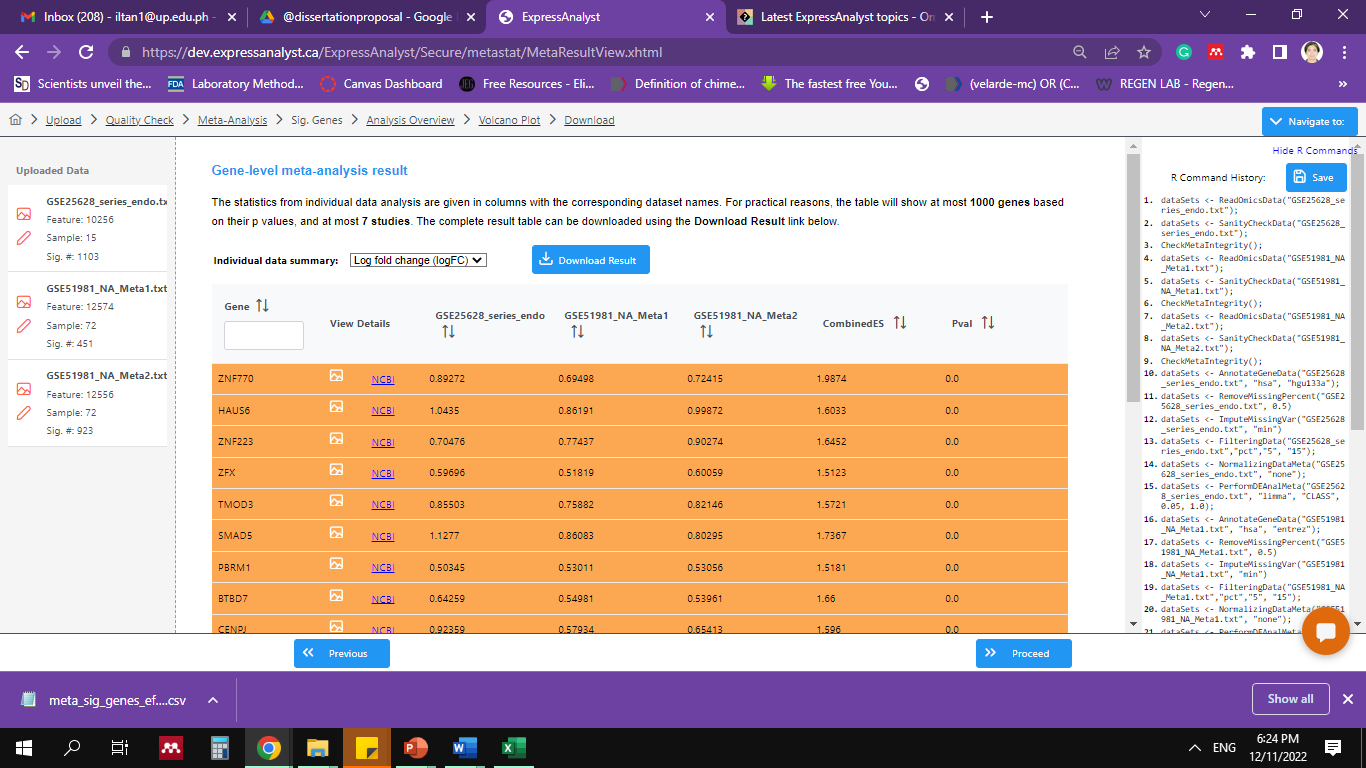
only shown the significant genes which in this case is 5631
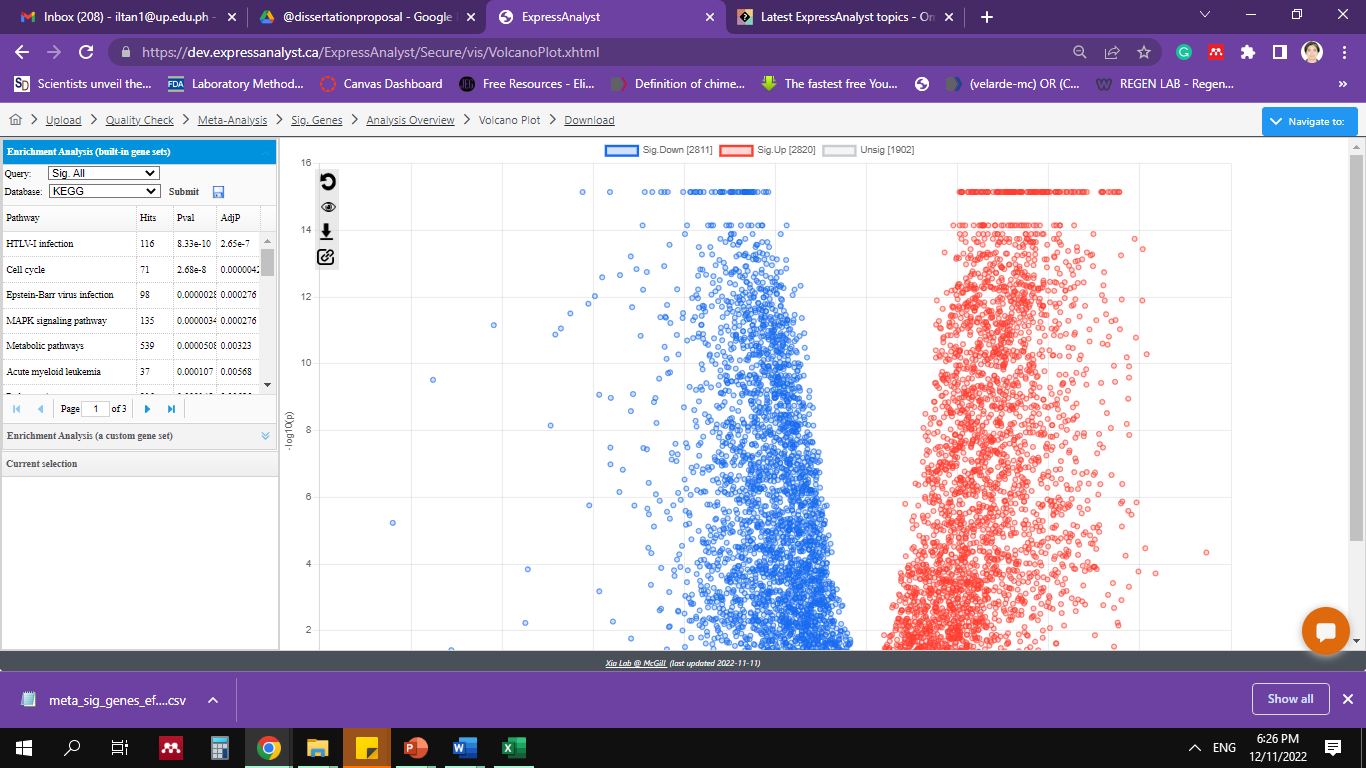
Is it possible to get as well the expression profile of the not significant 1902 genes as shown in the volcano plot.
In single gene analysis, I can get the entire expression profile (both the significant and not significant genes) when I open it in Excel. Thanks.