Q-Q plots are graphical tools to determine whether the assumption that the data came from a specific parametric distribution is plausible. They are generated by plotting the theoretical and actual percentiles against each other in a scatter plot. If the points fall on the diagonal straight line, it is reasonable to assume that the data came from that type of distribution.
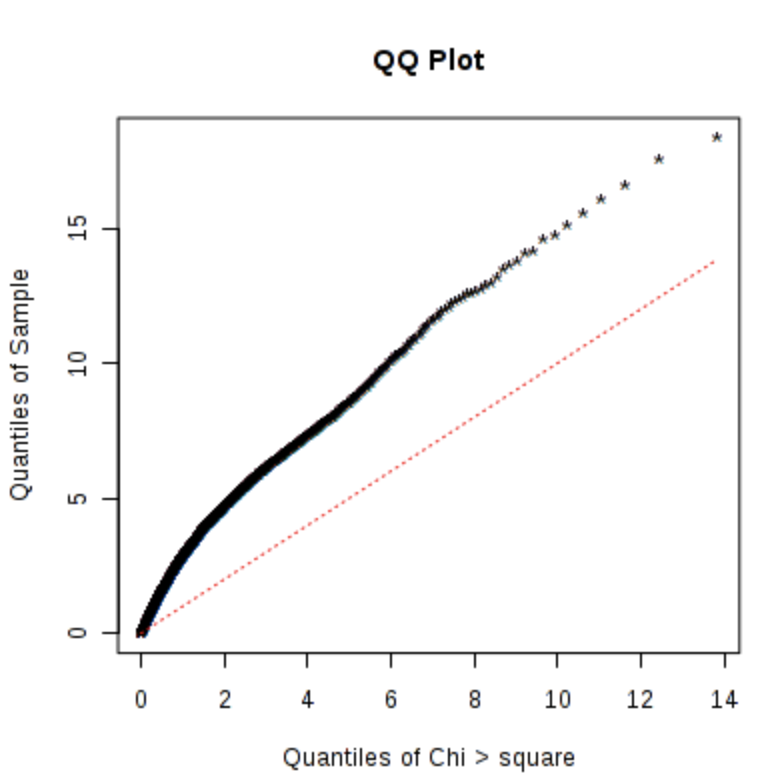
The FEM (fixed effect model) assumes a chi-squared distribution, and ExpressAnalyst supports a Q-Q plot to check the validity of this assumption. The data will rarely fall perfectly on the straight line, even when they are randomly sampled from a known distribution, so you should look for large deviations such as the Q-Q plot below. In this case, since there is a significant deviation, the REM (random effect model) may be more appropriate since it does not assume any parametric distribution.