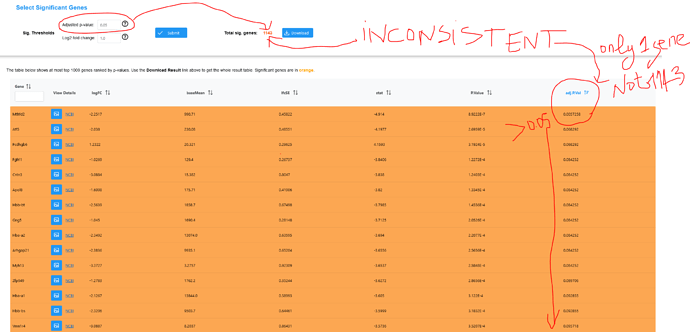
Using a the feature selection criteria of 0.05 and log2Fc of 1, I get Total sig.genes of 1143 that are colored in orange. Yet, the sorted table --from lowest adjusted p value to the highest-- show only 1 gene that truly verifies those criteria.
I get the same output using networkanalyst3
Below is the R command history and I’ve attached a snapshot and the raw count data set.
ReadTabExpressData(“All_CO_vs_All_TxO.txt”);
PerformDataAnnot(NA, “mmu”, “count”, “symbol”, “mean”);
PlotDataBox(NA, “qc_boxplot_0_”, “72”, “png”);
PlotDataPCA(NA, “qc_pca_0_”,“72”, “png”, “NA”);
PlotLibSizeView(NA, “libsize_0_”,“72”,“png”,“NA”);
PlotDataDensity(NA, “qc_density_0_”,“72”, “png”, “NA”);
PerformExpressNormalization(NA, “logcount”, 15, 3, 5,“true”);
PlotDataBox(NA, “qc_norm_boxplot_0_”, “72”, “png”);
PlotDataPCA(NA, “qc_norm_pca_0_”,“72”, “png”, “NA”);
PlotDataDensity(NA, “qc_norm_density_0_”,“72”, “png”, “NA”);
PlotDataMeanStd(NA, “qc_norm_meanstd_0_”,“72”, “png”);
SetSelectedMetaInfo(NA, “CLASS”, “NA”, F)
CheckRawDataAlreadyNormalized();
SetupDesignMatrix(NA, “limma”);
PerformDEAnal(NA, “custom”, “TxO vs. CO”, “NA”, “intonly”);
SetupDesignMatrix(NA, “deseq2”);
PerformDEAnal(NA, “custom”, “TxO vs. CO”, “NA”, “intonly”);
All_CO_vs_All_TxO.txt (1.1 MB)
