Dear everyone,
I see that a few people have posted about the same issue, as I’m about to share with you, but no solution was given in these threads, so hopefully this post will solve it for good.
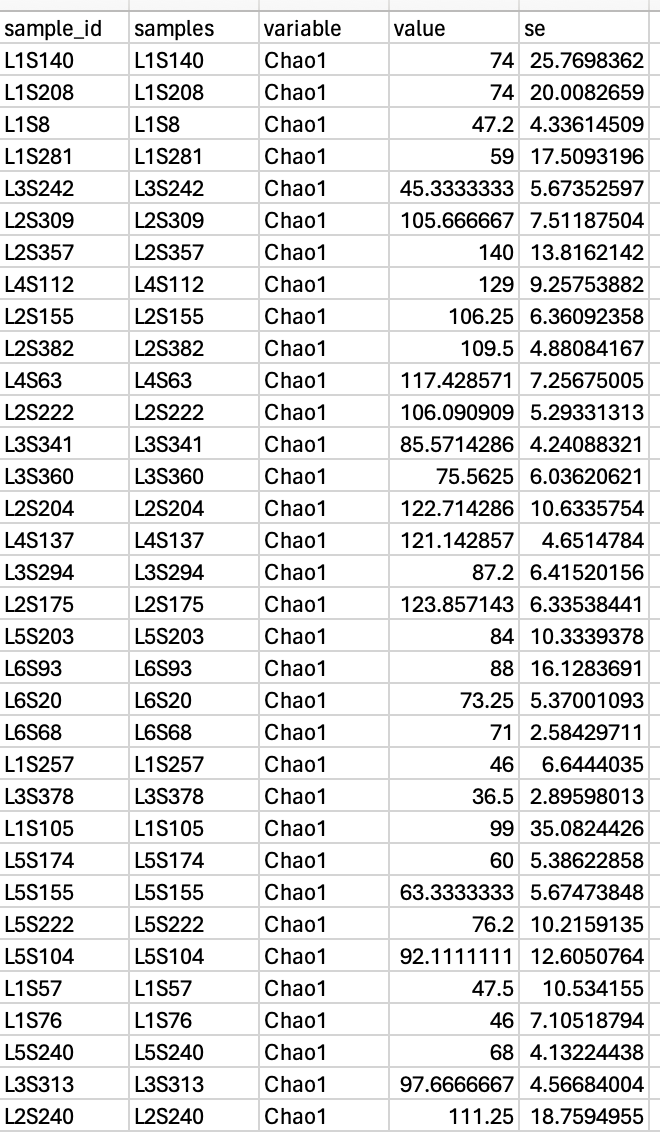
When using Marker Data Profiling to compute any alpha diversity indices (for instance Chao1), I experience that the values are much higher, when I download the result table (see the attached csv file) and compare them with the plotted values (see the attached pdf file). How do I extract the plotted values from the web server? Or do I need to calculate them myself using the “value” and “se” columns from the result table?
The same happens when I try to use your example data, like “Human Moving Picture”.
Thank you very much in advance.
alpha_diverbox_1.pdf (13.0 KB)
alphadiversity.csv (9.2 KB)
No one has an answer or solution to this problem?
It is not clear what is the issue and what we could do (except extracting values from R graphics - which is quite an unusual request). MicrobiomeAnalyst aims to be maximal transparent:
- The calculation is based on phyloseq package. The output table is already provided for each sample (value and SE).
- You have access to the underlying R command history and the MicrobiomeAnalystR package.
Thank you for the answer.
I’m aware that extracting values might be unusual, but I need it for further analysis. I’m still pretty new to coding in R, so I don’t feel competent enough to carry out the entire 16S data processing and analysis on my own yet. I’m very grateful for the service you provide.
I will try to emphasize the problem that I encounter by using the example data “Human Moving Picture”. If you use just the standard data filtering and normalization before calculating the alpha diversity using the Chao1 index (feature level as taxonomy and SampleType as experimental factor), you get a nice graph in which the lowest and highest measurements are quite clearly around 40 and 140 on the y-axis, respectively. However, if you then attempt to download the result table, the values start at 46 and go all the way to 8,55714E+14. Any kind of transformation of these data does not result in any meaningful numbers when compared to the graph.
alpha_diverbox_0.pdf (11.3 KB)
alphadiversity (1).csv (2.7 KB)
This is still a mystery to me about extremely high Chao1 value you refer to.
I took a screenshot on the table you provided (see below) - can you let me know which sample ?
Ah, thank you - now, I know what the issue is. The problem arises when I attempt to import the CSV file with US formatted numbers into a Danish localized version of Excel, thus removing all the commas.