With SDP, when generating a heatmap from a list of KO abundance, each KO is grouped according to the dendrogram shown on the right on the heat map. I assume they correspond to the KEGG pathways/modules, but the information isn’t available. With my data, I have signficant differences at the 1st and 2nd levels. I was wondering if it’s possible to extract this information with the heatmap?
Thank you!
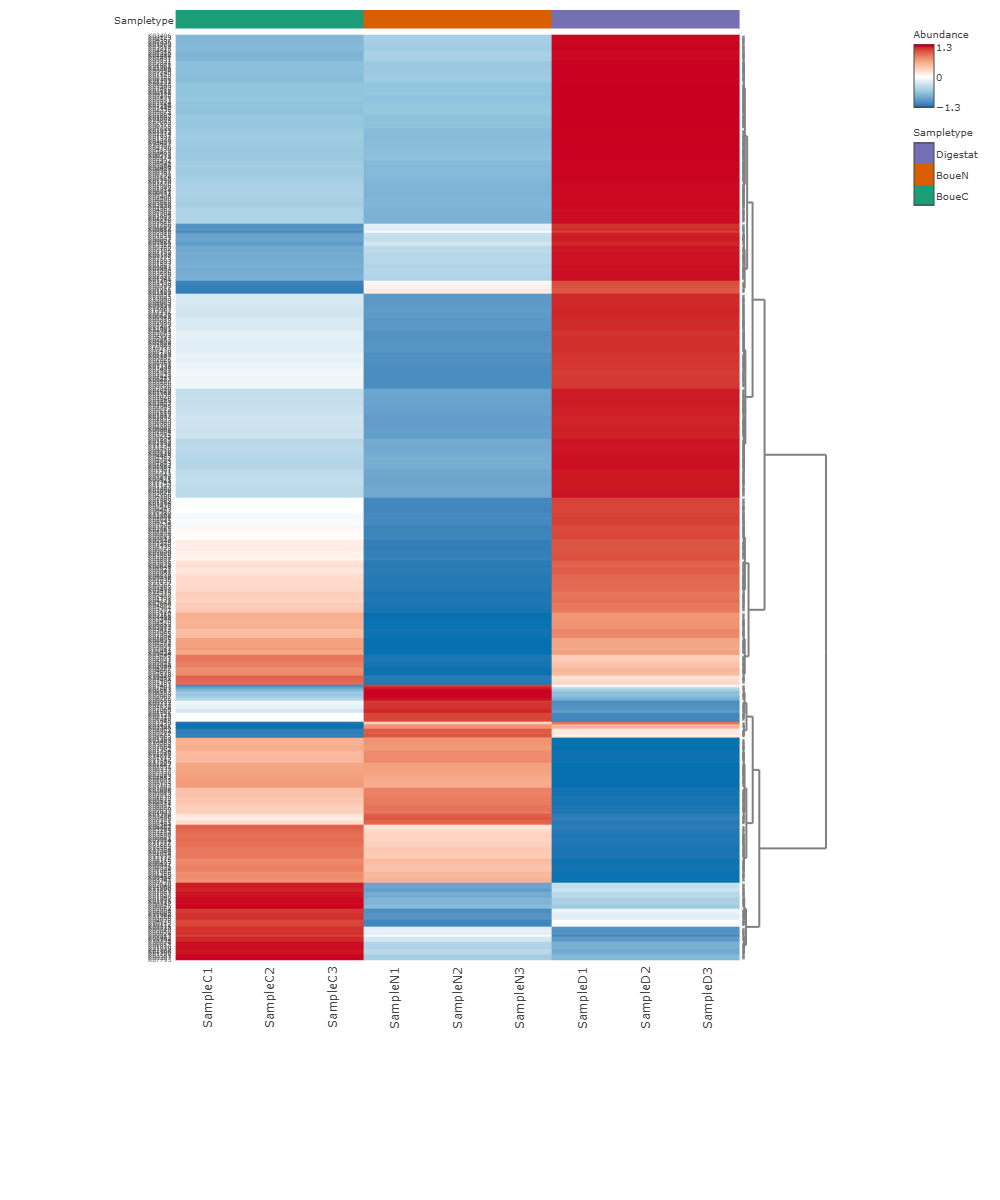
It is relatively straightforward to get the feature names for a pattern of interest in a heatmap.
-
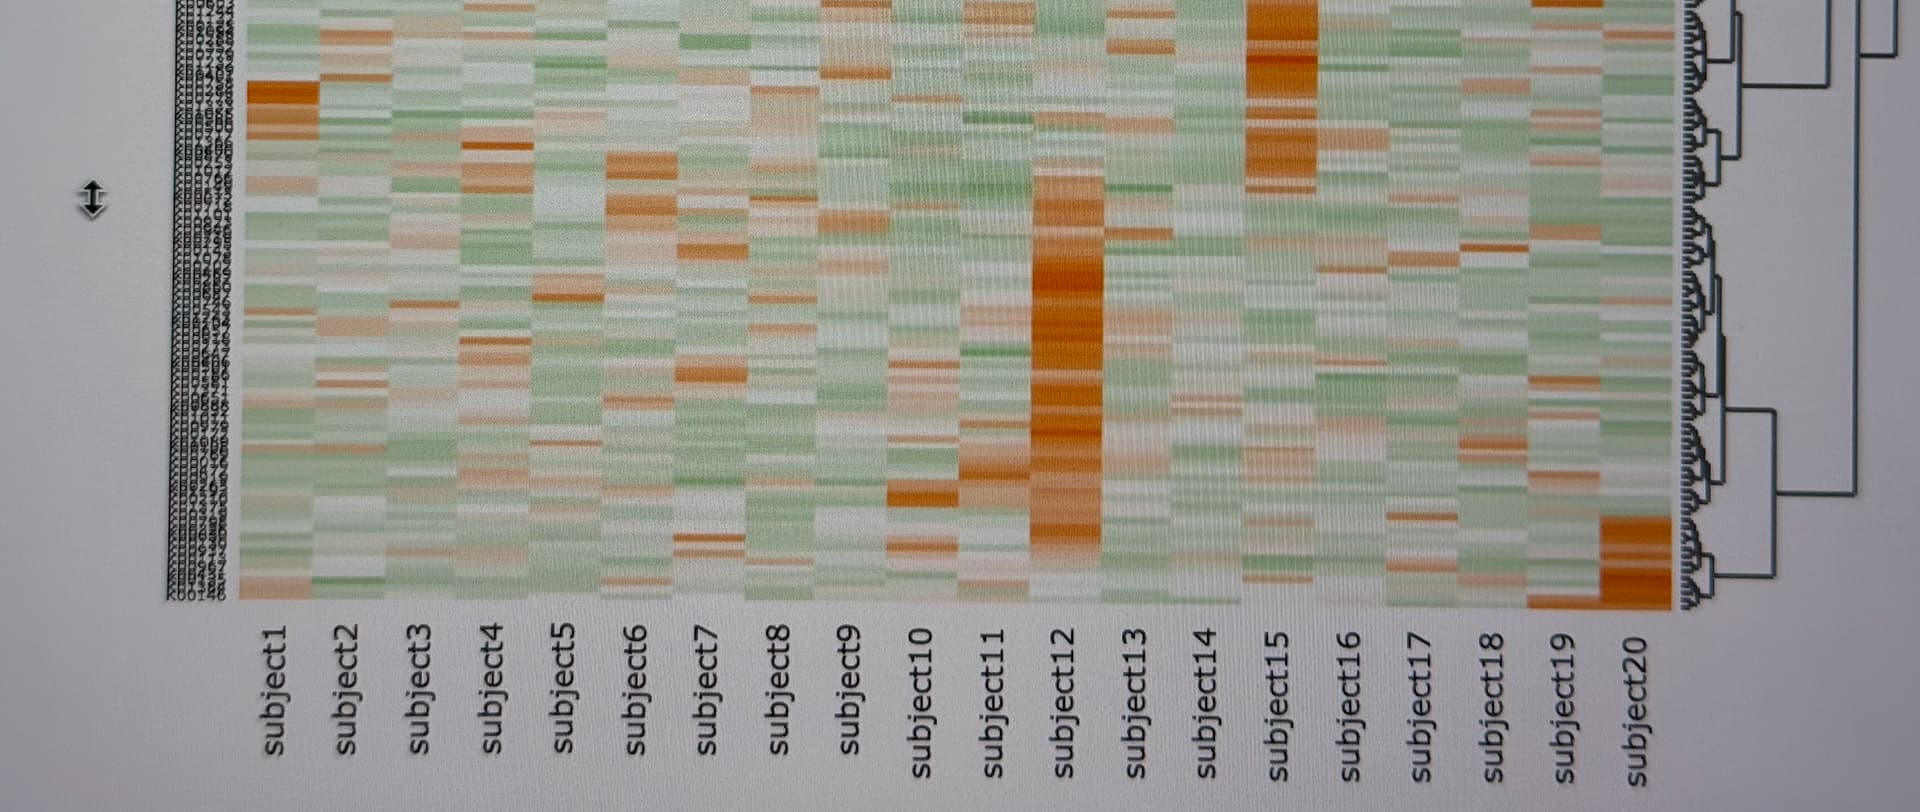
Select the region. Put your mouse to the feature side, until its shape changes to a double arrow (see below)
-
Drag the mouse to select the features spanning the region of interest. Upon completion, the selected region will be displayed as zoom-in heatmap (note you can double click to reset the heatmap)
-
Download the zoom-in heatamap as SVG. You can now open SVG in a web browse (or other tools that support SVG), and select the text. I generally choose to select all text on the SVG and manually remove sample names.
Hi, thank you for your answer!
However, this is not what I was referring to. If I zoom, yes I can see ever KO numbers individually on the left of the map, but I was talking about the dendrogram on the right of the map. The features seem to be clustered with the KEGG pathway modules of different levels. I was wondering how I can get access to this information because the abundance of the features in my samples are highly correlated with this clustering.
Thank you again!
The features seem to be clustered with the KEGG pathway modules of different levels
To answer your question
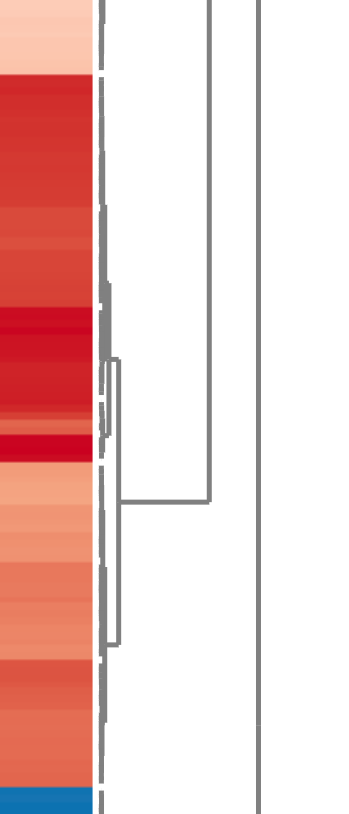
- identify the cluster (visually on the heatmap)
- obtain those features that forming the cluster;
- perform pathway enrichment analysis based on the feature names.
This topic was automatically closed after 5 days. New replies are no longer allowed.