Hello, I am Sophie, a MSc student in Nil Basu’s lab.
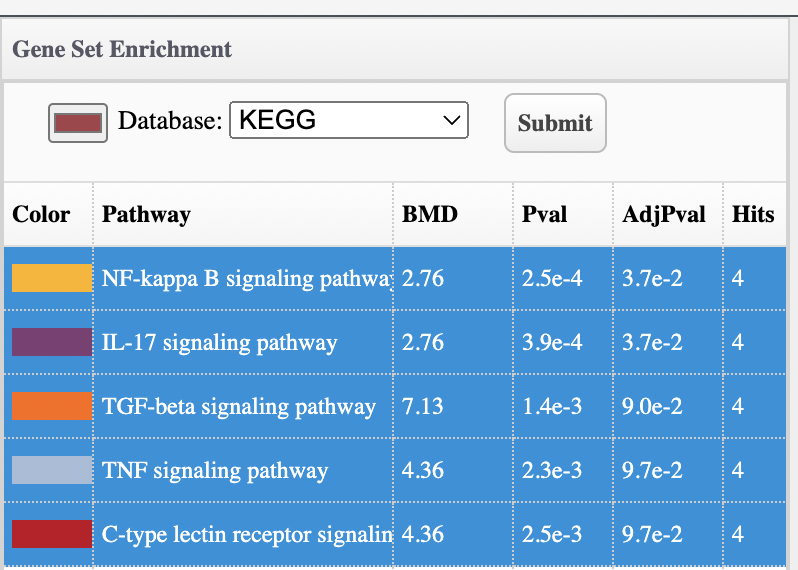
I am analyzing count files from RNA-seq and am coming across a common problem where I am getting different results from EnrichNet and pathway accumulation options. When I open up Enrichnet it gives me specific pathways, the p-value and adjPvalue. However, when I go to get pathway BMDs in the accumulation plot option, I get different adjP-values for the same pathways. In this following example, when I open up EnrichNet it gives me 0 significant pathways, but when I go to pathway accumulation to get pathway BMDs I get 2 significant pathways. Gene BMDs are also different between these 2 options. Please see screenshots below.
Thanks and I look forward to hearing from you

Hi Sophie,
I looked at the code and the accumulation plot enrichment analysis was imported from the FastBMD tool, where a different approach was used to estimate one of the parameters. Neither is really “right” or “wrong” (just different), but the accumulation plot method is more commonly used. We’ve updated the methods in the volcano, heatmap, and enrichment network to match what is done in the accumulation plot. It should be online in a day or so.
Jess
Hi Jess,
Thanks so much for the help!
Sophie
The adjusted p-value may still be slightly different … in the accumulation plot, we only perform the analysis for pathways with at least 15 genes and the other tools perform it on all of the pathways. Adjusted p-values depend on the total number of p-values being corrected, so they will vary slightly.