Yes, MicrobiomeAnalyst allows users to color samples based on their alpha diversities or the abundance level of a feature of interest. To do so, users need to
- Select “Beta-diversity analysis” from the Analysis Overview.
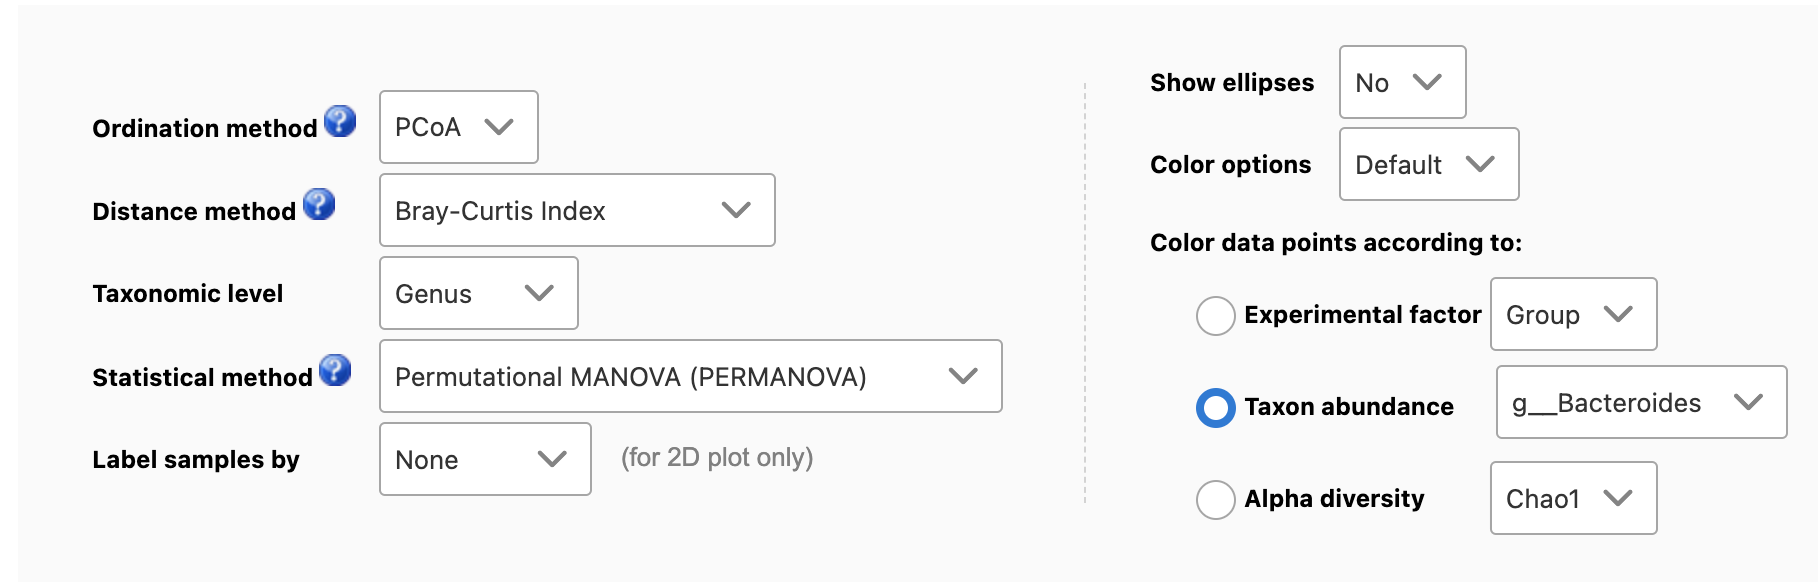
- First select a taxonomic level (i.e. Genus), and select the feature of interest (i.e. g__Bacteroides), see below
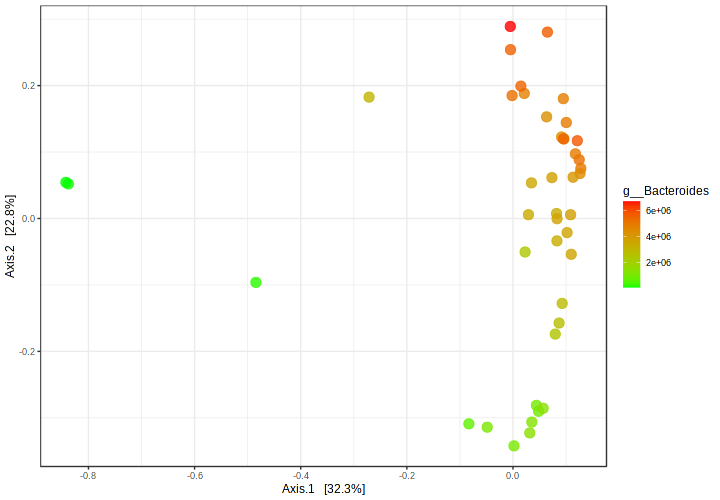
- Click the “Update” button. An example output is given below. It is clear that the feature abundance is strongly associated with the patterns of sample distribution
Please refer to this post for more discussions