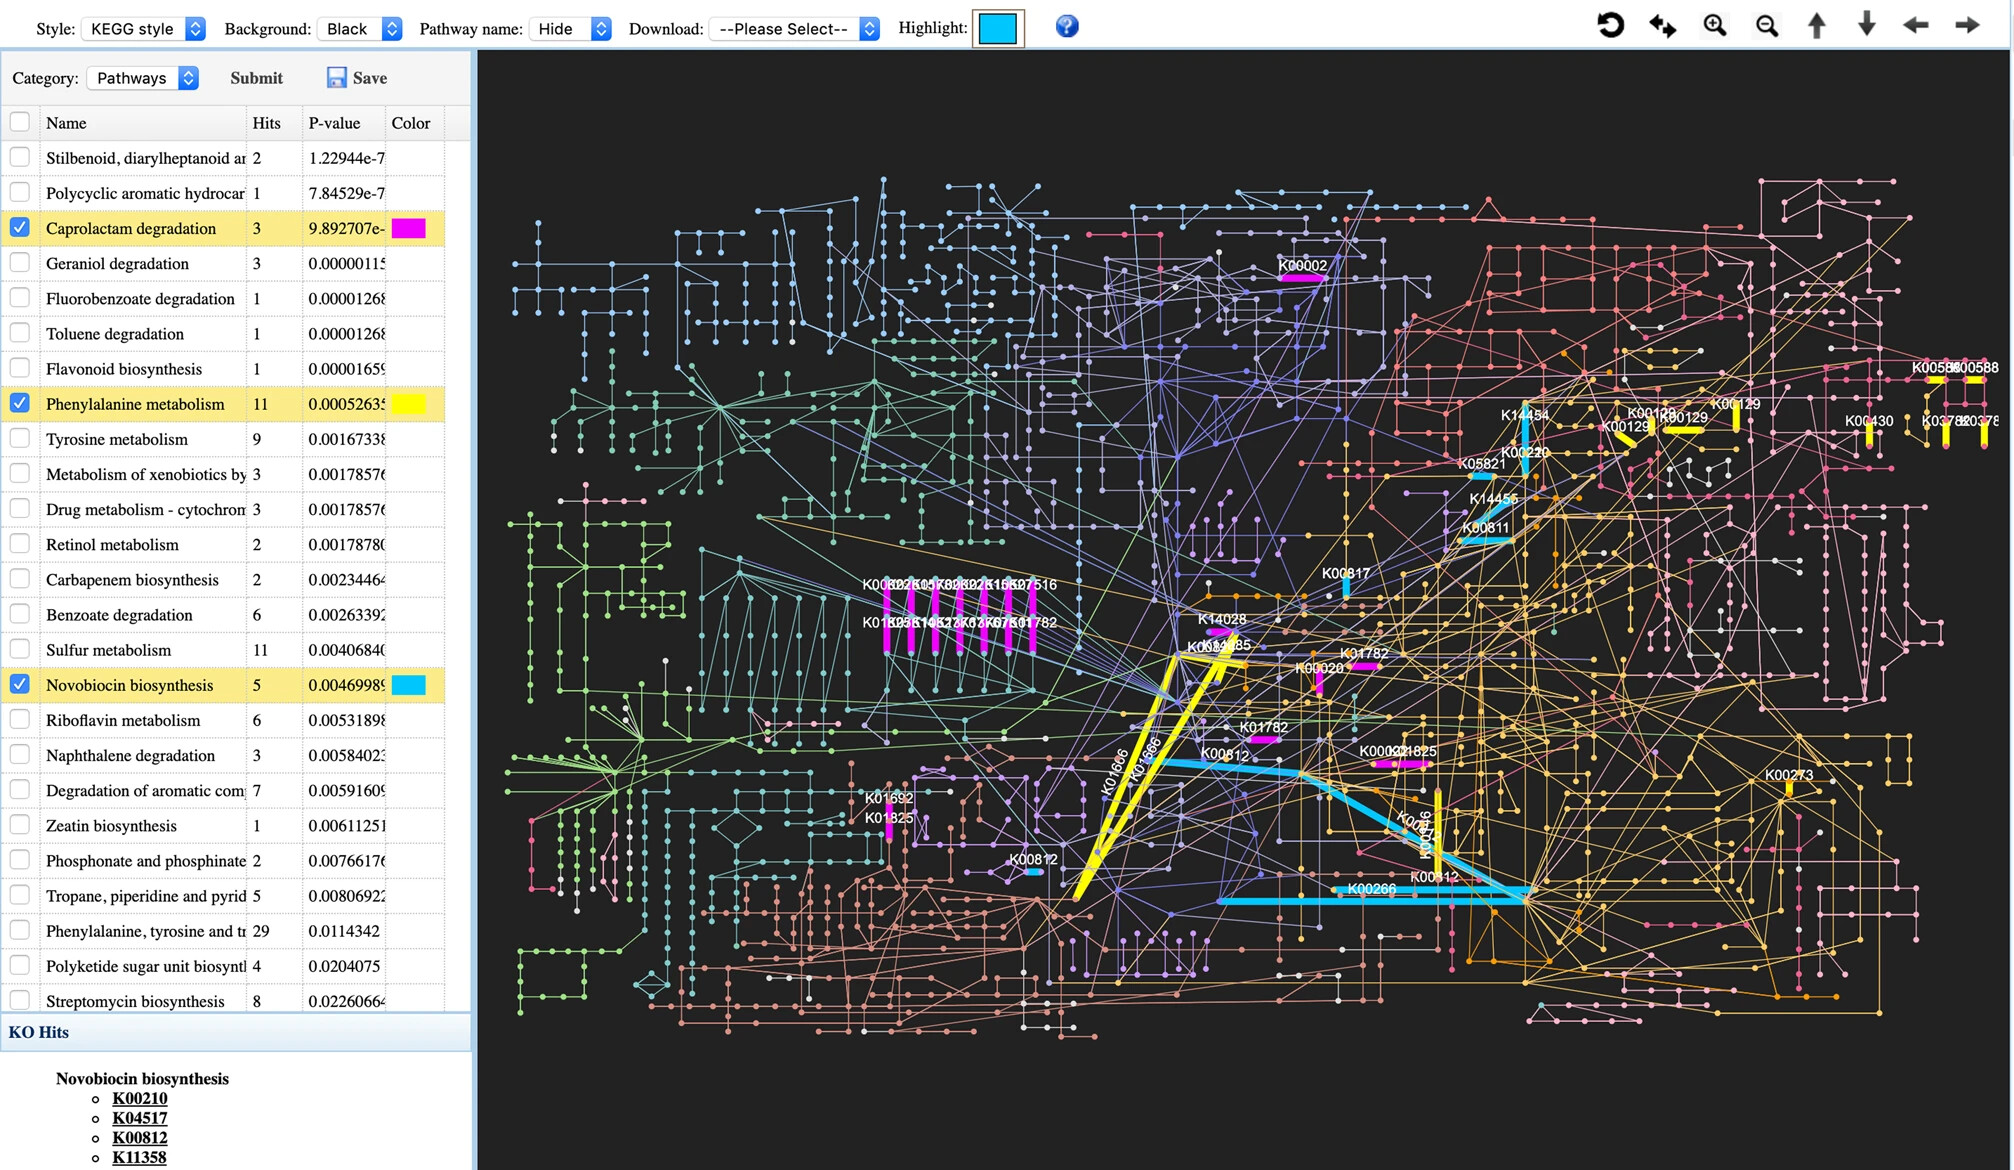
The network framework has been developed based on the KEGG global metabolic network using the KEGGscape, followed by manual curation. The metabolic network is displayed in the central area of the screen, with nodes and edges representing metabolites and enzymatic reactions, respectively.
- Users can use the mouse scroll to zoom in and out of the network;
- Users can view the reaction information (KO and compounds) by double clicking on an edge;
- Users can also change the background color, switch the view style, specify a highlighting color or download the current network view as a PNG or SVG image.
You can also try other similar tools such as the iPath2.0 and the native KEGG (SVG based).