For untargeted metabolomics anayliss, I have 8 biological replicates for each sample. When we are performing differential metabolite analysis (such as fold change >2, VIP >1, P value <0.5), for one compound, some replicates have a value (relative peak intensity), while other replicates have no value (empty). How could we calculate the overall fold change (or VIP score, P value) for this sample and define if it is differential or not compared to other samples?
1 Like
I am not sure about the experimental design based on your description
-
If you mean 8 technical replicates for each sample (i.e. one sample measured 8 times)? If so, you should first merge technical replicates, as most analysis methods in MetaboAnalyst assume independent samples (i.e. biological replicates)
-
If you mean 8 biological replicates for each group, and you have two or more groups, it is the typical design, and you can directly upload it to MetaboAnalyst for statistical analysis.
1 Like
Yes, it is the second option, 8 biological replicates for each group. My meaning is that how does MetaboAnalyst treat 8 biological replicates for statistical analysis if there is a big difference among these biological replicates?
If your samples are very heterogeneous even within the same group, then it could be difficult to draw conclusions in statistical analysis. For untargeted metabolomics, you can:
- Increase sample size
- Remove potential sample outliers
- Missing value estimation
- Data filtering
- Data normalization
MetaboAnalyst offers comprehensive support for options 3,4,5. You should follow our detailed tutorials (such as this protocol) on these topics. Note the data for downstream statistical analysis is save as data_normalized.csv in your “Download” folder. You can open this file using any Spreadsheet program to see the actual values for your feature of interest
Thanks for your reply. I did not know that we could generate the report.
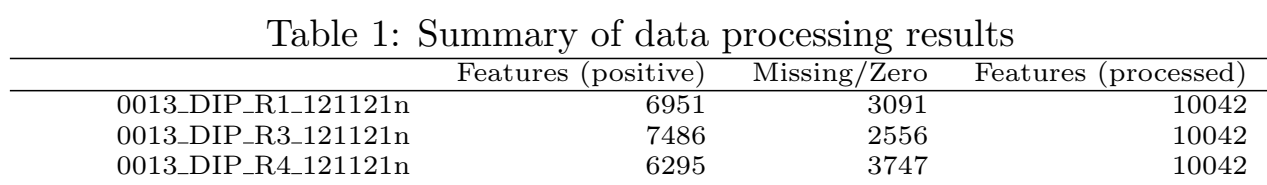
I still have one question about the data processing. I’ll use my own data as an example. I have 10042 features for input, around 5000~7000 features (for all samples) are left (see picture below) after the steps of data filtering and normalization, but only 2500 features are used for the following statistical analysis, as shown in the files “data_processed.csv” and “data_normalized.csv” . Furthermore, there is also one sentence in the report : “Further feature filtering based on Interquantile Range Reduced to 2500 features based on Interquantile Range.”
My question is: why did you only choose 2500 features for the following statistical analysis?
The short answer is that we need to have a default value, but there are many other options. I would strongly encourage you to read the details on the Data Filtering page.
Another related post is here