I used MetaboAnalystR package to process my raw data.
and the package output 2 csv files as “metaboanalyst_input.csv” and “annotated_peaklist.csv”
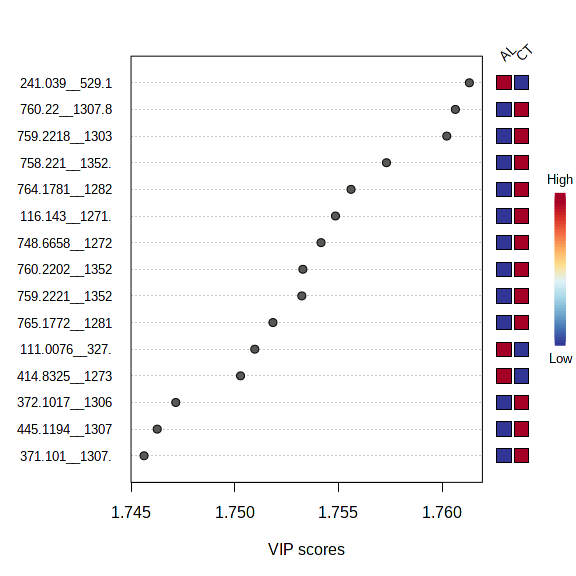
After getting these 2 files, I upload “metaboanalyst_input.csv” to MetaboAnalyst 5.0 website ----> statistical analysis(one factor) and output the OPLS-DA VIP results.
The statistical analysis modules do not perform any annotation - whatever ID types you upload are the ones displayed in the results.
Since you are already in R, I suggest using the ‘merge’ function to re-label your numerical peak IDs with the compound names. Then, if you analyze this labeled table in MetaboAnalyst, you will get the results with the compound names.
Thanks for your good advice.
But I can not find the “merge” function in metaboAnalystR package, is there any code available to map the peakIDs with the compound names?
You should search how to load a .qs file into R. There is a library for it.
It seems that you are not so comfortable using R - in this case, I suggest that you mainly use the web version of MetaboAnalyst, or take some introductory course to programming in R. There are many good tutorials online.