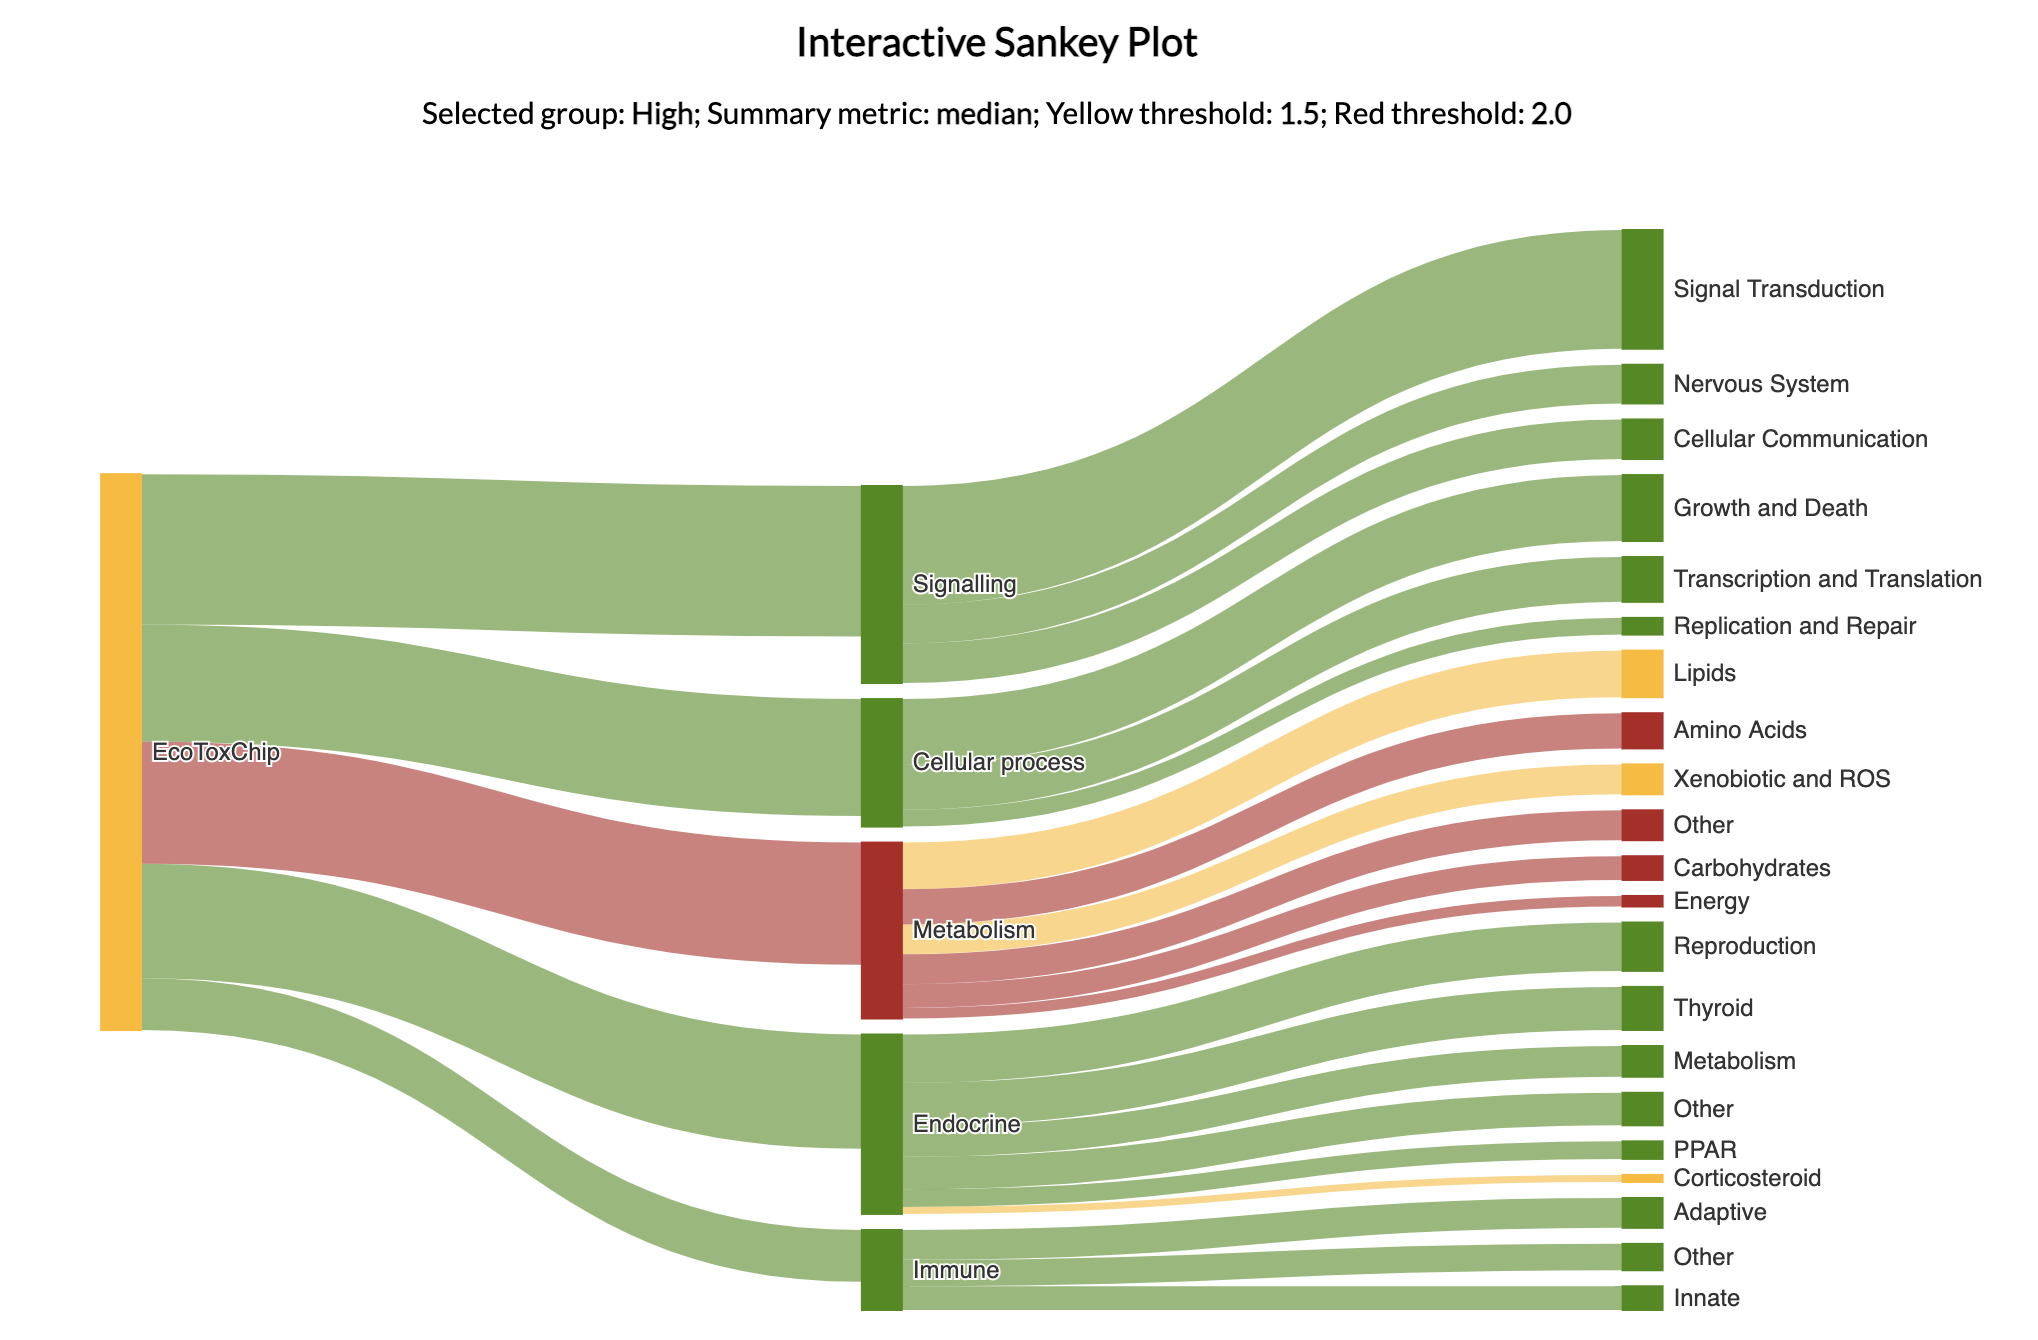
Either the mean or median of the abs(log2FC) for every gene on the EcoToxChip is computed to get a summary score for the whole chip. The colour is then determined by comparing it to the thresholds. The same method is used to determine the colour for each process and module.
An example output is shown below. Note the key parameters are provided under the title.