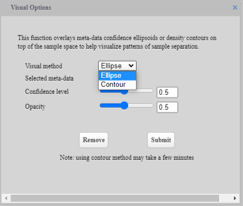
OmicsAnalyst uses kernel density estimation (KDE) from “ks” R package to estimate a probability density function of a random variable. The resulting probability cloud represents the density estimate corresponding to 50% confidence interval, and can help to show separation between sample groups. To perform “Contour” highlighting:
-
Click on
 icon located in the vertical tool bar.
 -
On the dialog select Ellipse option under “Visual method” and click “Submit”
-
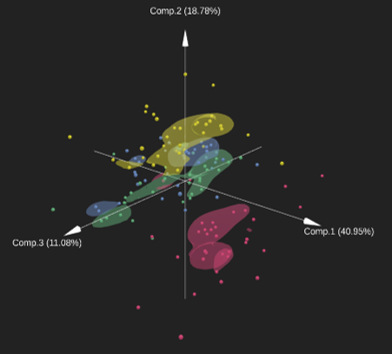
Here is the resulting contour visualization