In enrichment network, gene sets are represented by the nodes, and edges indicating there are shared genes among them.
- Nodes are coloured according to their enrichment score (GSEA) or p-value (ORA) from the results table.
- The size of the node corresponds to the number of genes from that gene set that are on the analyzed gene list.
- The edge between two gene sets indicate that they share common genes;
- ExpressAnalyst uses overlap coefficient (OC) to calculate whether an edge is connecting two datasets. It is calculated by taking the average of overlap divided by the size of set1 and overlap divided by the size of set2. An edge will connect the two sets if the resulting value is above 0.3.
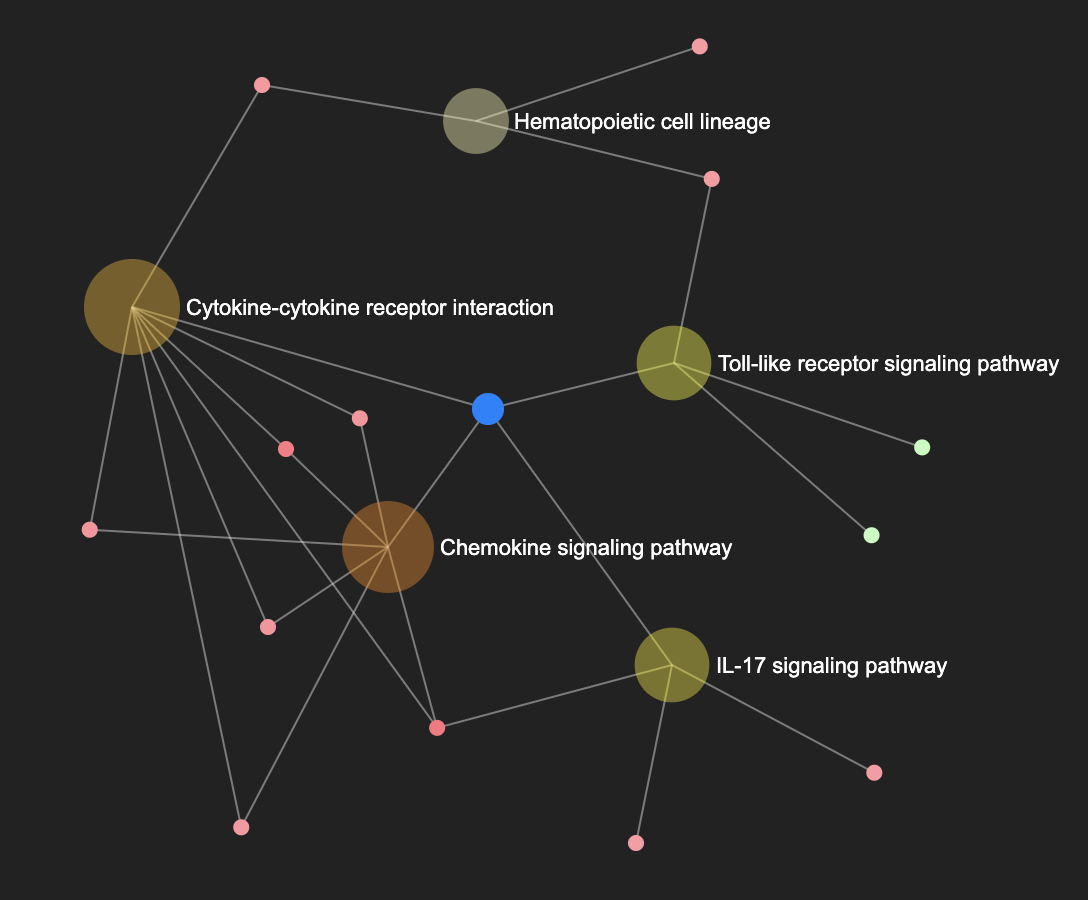
- You can see those details using the “Bipartite network” view mode. The solid, small nodes correspond to individual genes, and they are coloured according to their fold changes. See an example below: