ExpressAnalyst support two types of enrichment analysis - over-representation analysis (ORA) and gene set enrichment analysis (GSEA). Their usages are described below.
ORA requires a list of genes of interest, and can be used for all different types of input (gene list, expression table or multiple expression datasets). In ExpressAnalyst, ORA is used in the following visual analytics methods
- Volcano plot (users can drag-select genes of interest)
- Enrichment Network (ORA)
- Ridgeline Chart (ORA)
- Interactive Heatmap (ORA)
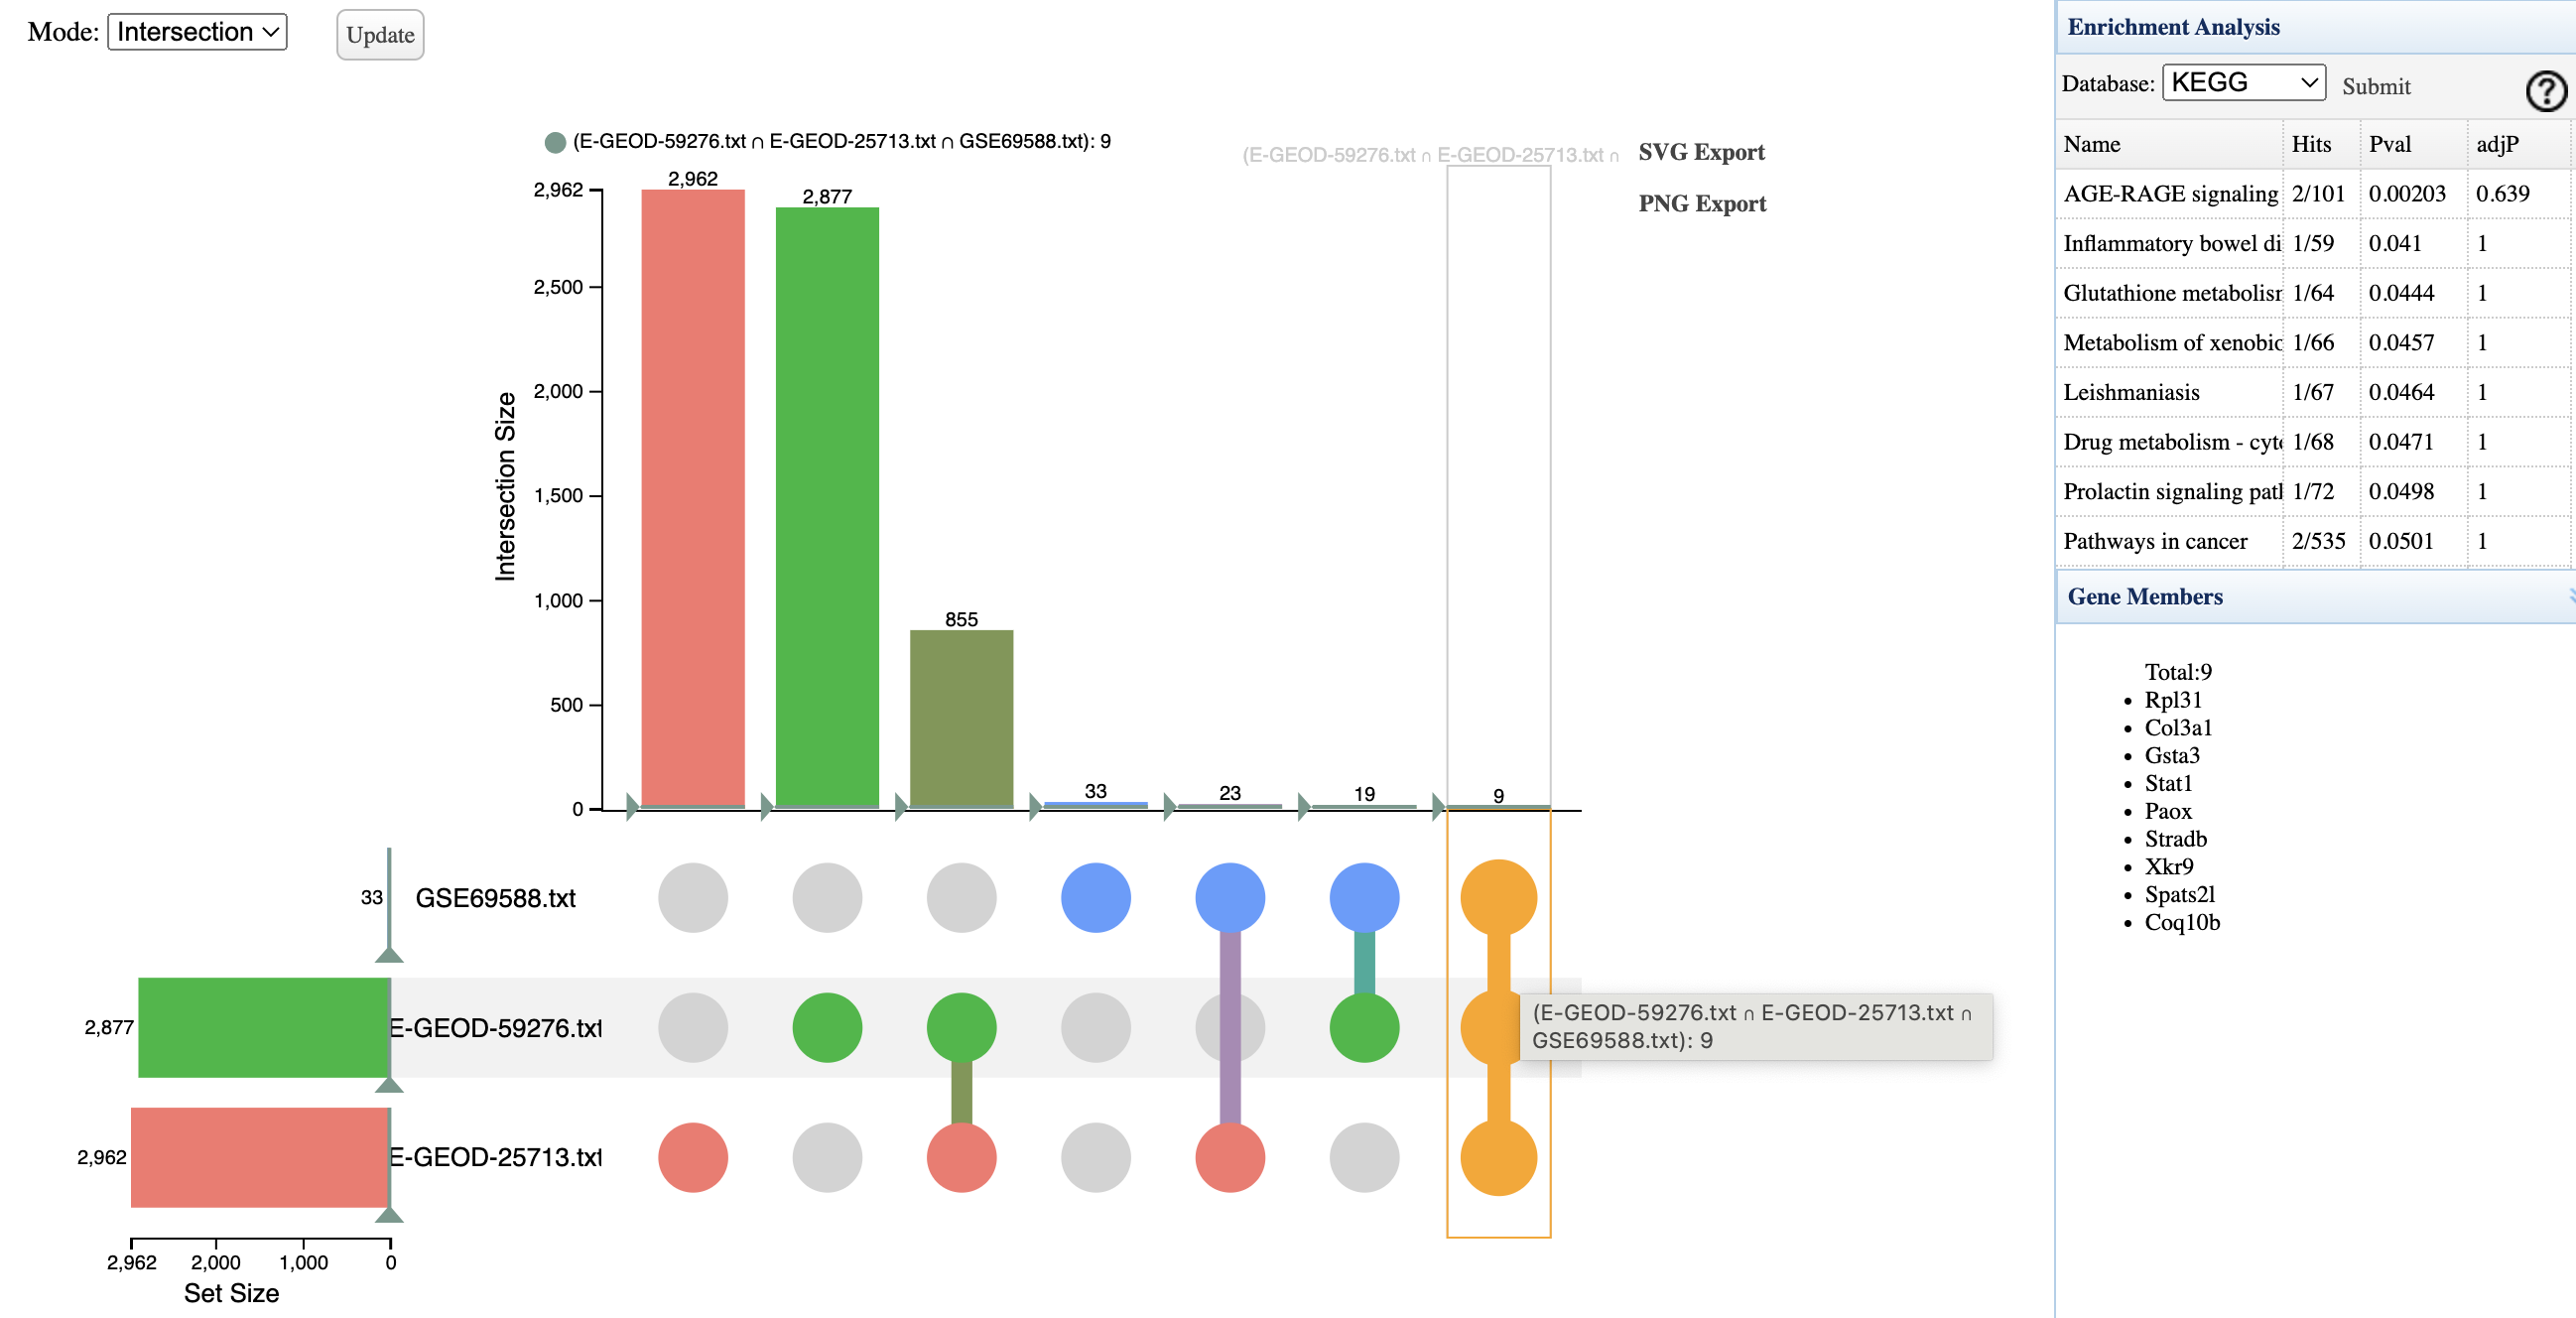
- Upset Plot (users can click any column to select intersections of genes, see the Fig below)
GSEA requires an entire profile of gene expression values, and cannot be used when only a list of genes are provided. In ExpressAnalyst, GSEA is used in the following visual analytics methods
- Enrichment Network (GSEA)
- Ridgeline Chart (GSEA)
- Interactive Heatmap (GSEA)
The fig below shows a screenshot of ORA on significant genes shared across three datasets. Users first click on the last column (in orange) to select the shared genes, and then perform enrichment analysis.