Hello,
We would like to know why when we apply statistical analysis to a model of metabolites concetrations and go to the cross validation tab, the coefficients of Q2 change each time we update. Sometimes the optimal component changes, too.
1 Like
Cross validation involves randomly splitting the data into different groups, for example, 10-fold cross validation splits the data into 10 groups. Then, all groups except for one are used to fit the chosen model, and the final group is used to test the model. This is repeated until every group has been used to test the model (so, 10-fold CV means we repeat this procedure 10 times). This is useful, because then we can use the results from each prediction to estimate things like model accuracy, etc.
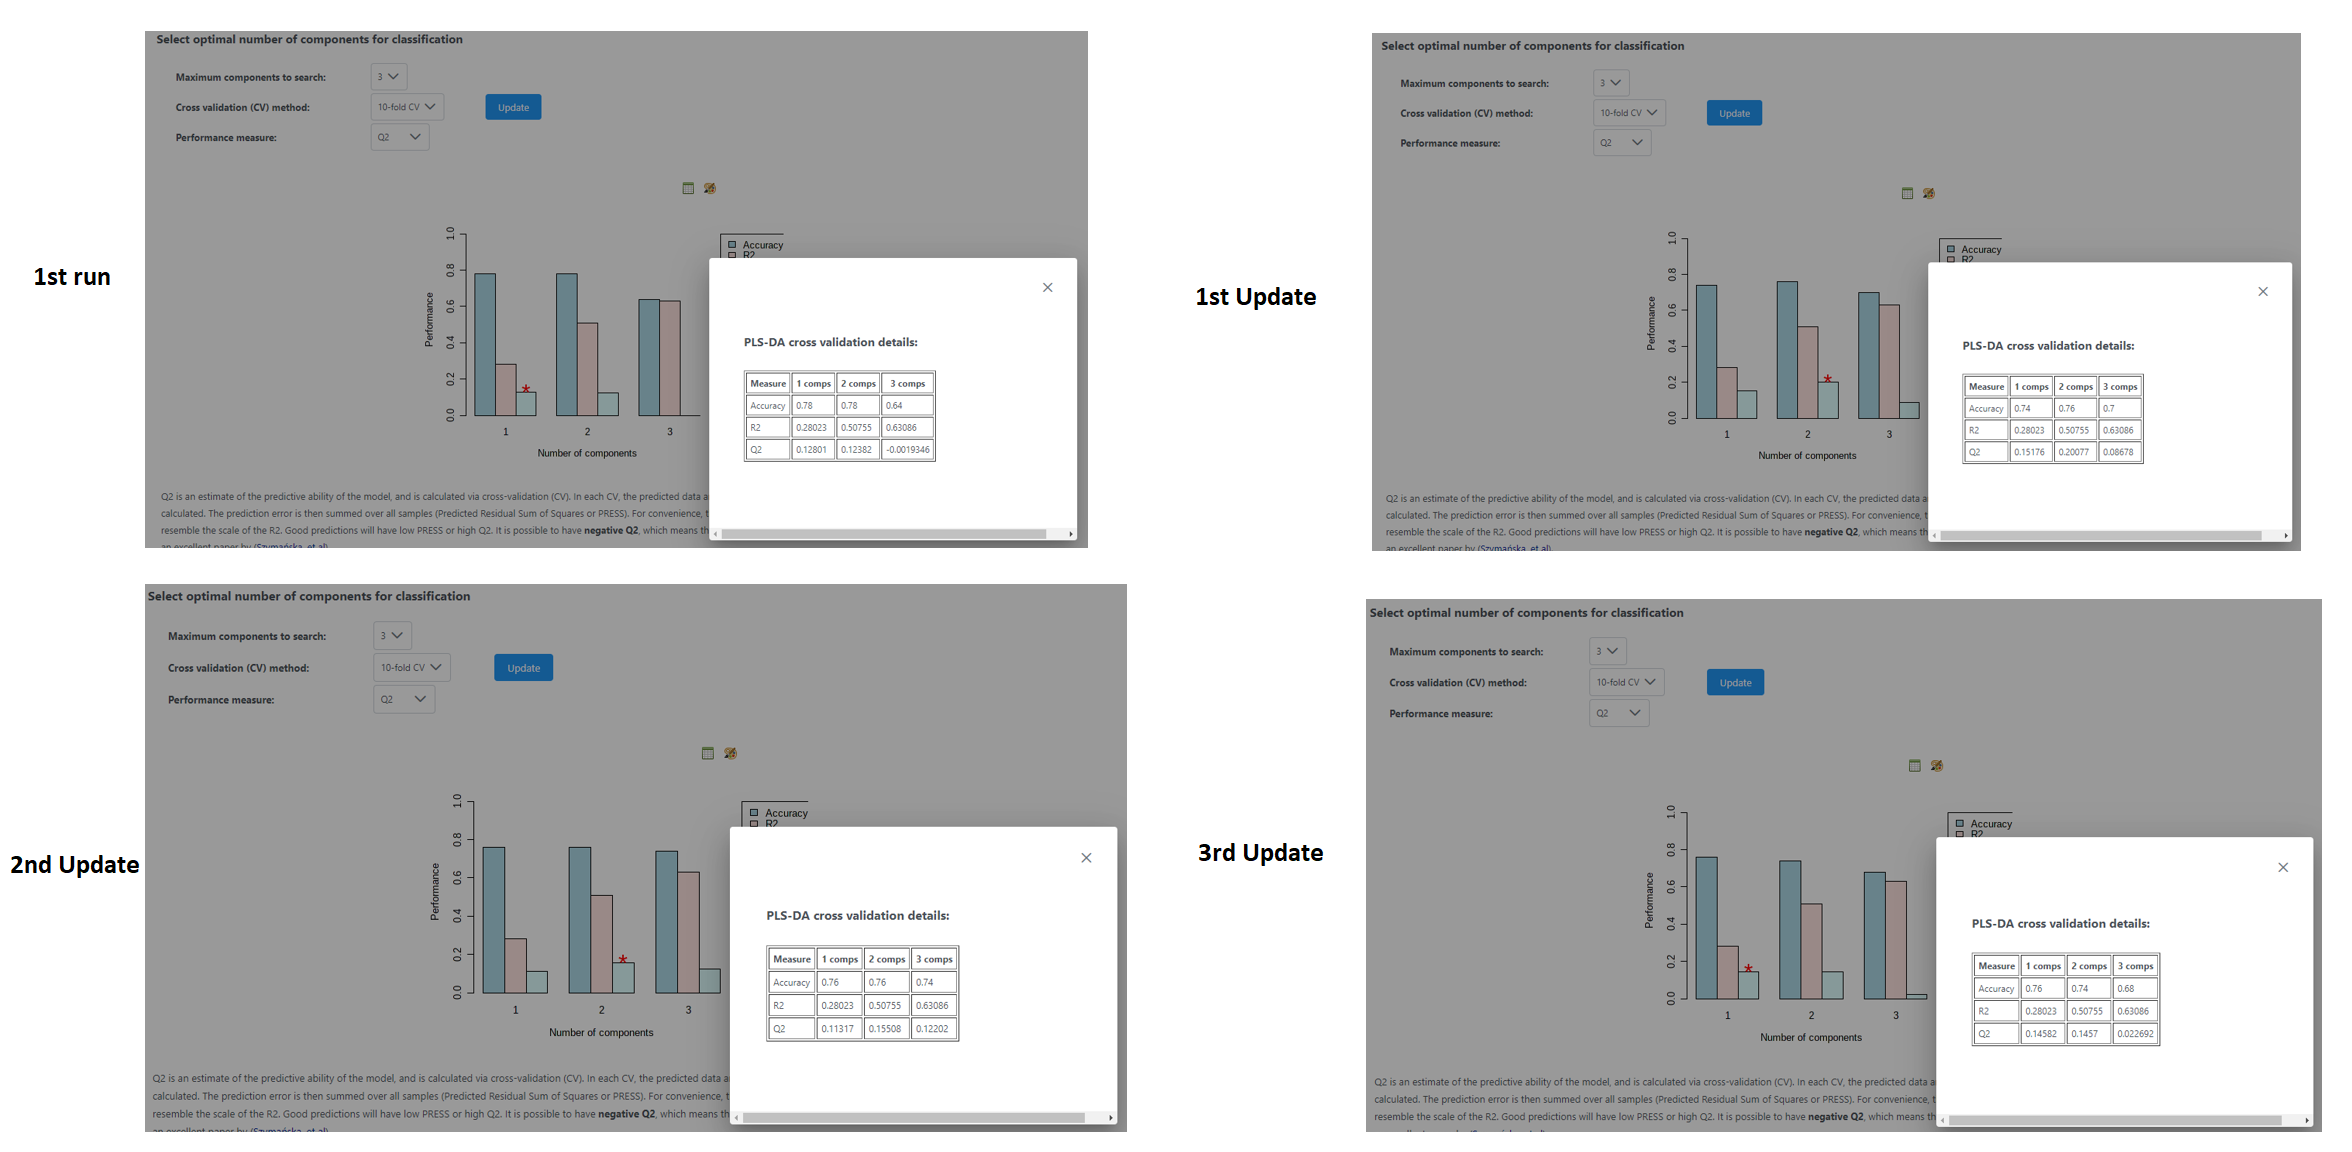
The results change slightly when you click ‘Update’ because the very first step (splitting the data into groups) is done randomly, so each time different groupings of the samples are used to train and test the model. If the optimal number of components is changing, for example between 1 and 2, it likely means that the model performance is very similar under these two scenarios, so the one that ‘wins’ can change depending on the random grouping pattern.
1 Like