Request Troubleshooting
When updating Heatmap by changing “metadata in annotation” or / and “sample arrangement”, the Heatmap does not change.
1. Tool & Module: Statistical Analysis [metadata table], Peak intensities, time-series + one factor, samples in columns (but als with rows)
2. Dataset: sample dataset: test data for time series + one condition (A. thaliana)
3. Steps leading up to issue:
- upload data and metadata: no issue
- proceed to data filtering: chose “none”
- proceed to normalisation overview: “sample normalisation: none”, “data transformation: log transformation”, “data scaling: mean centering”, normalise and proceed: no issue
- Chose Hierarchical clustering and heatmap visualisation: no issue
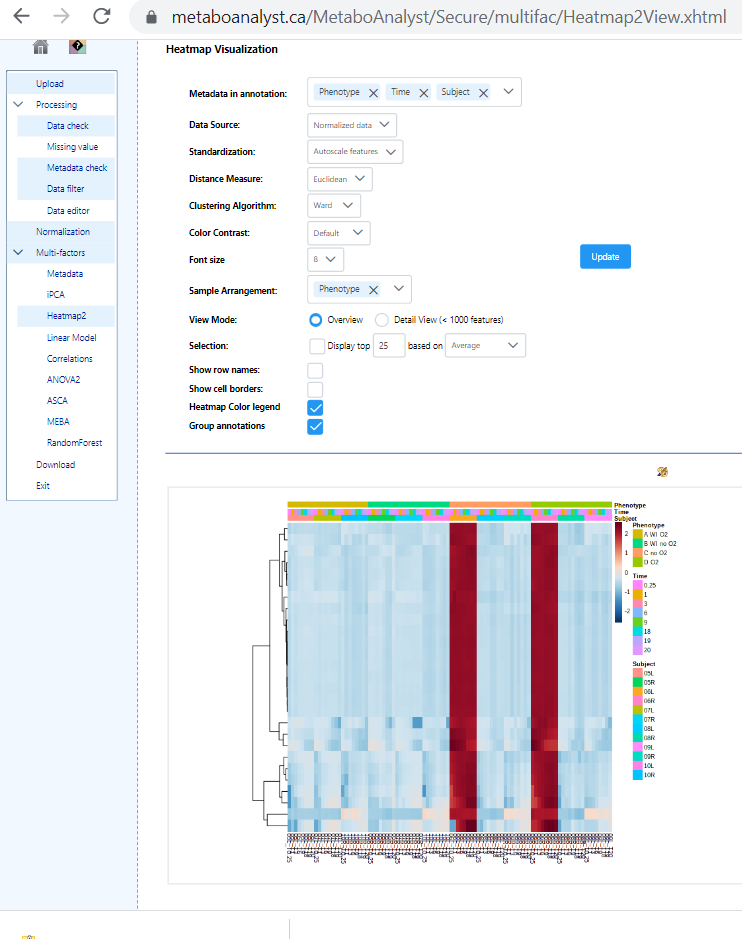
- by default the visualisations shows:
- “metadata in annotation: phenotype, time, subject” and “sample arrangement”: phenotype"
Screenshot
4. The issue
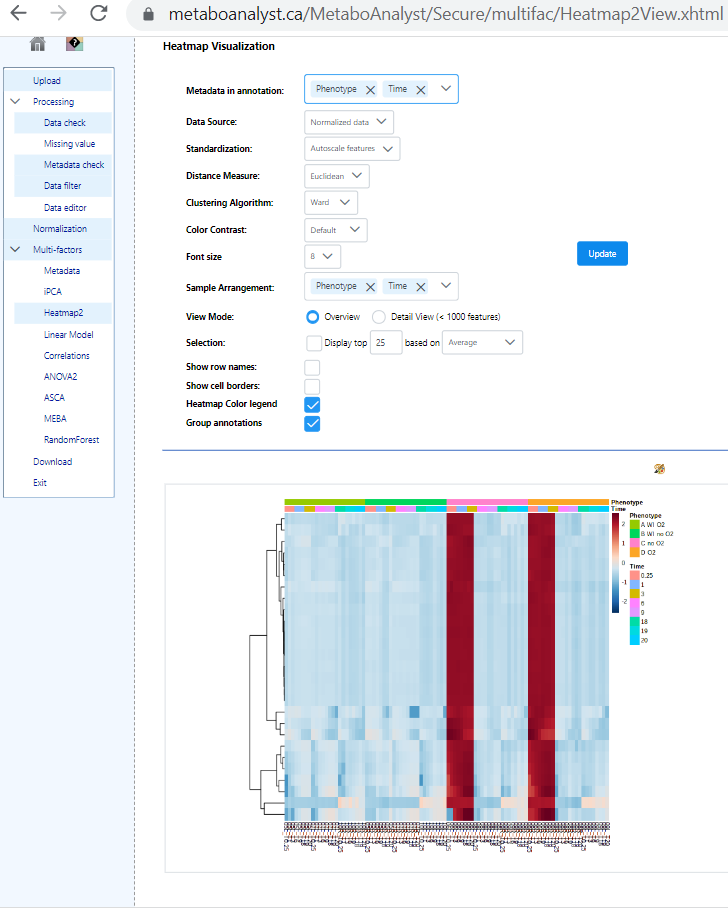
Then change “metadata in annotation: phenotype, time,” and “sample arrangement”: phenotype, time": here the issue arises:
the heatmap itself does not change even though the coloured blocks above the heatmap do.
Screenshot 2
Thanks for having a look and fixing the bug or helping us out.