Hello,
In the QEA analysis result table: each time I ran the analysis, the raw p-values seem to be inversely related to the q-values. How should I interpret this?
And which results should I consider significant? E.g. if I go with the standard for raw p-value (<0.05), I’m getting very high (significantly above expected) q-value; if I go with a low q-value, corresponding raw p-value is beyond anything considered to be significant.
Could this indicate problem with the data?
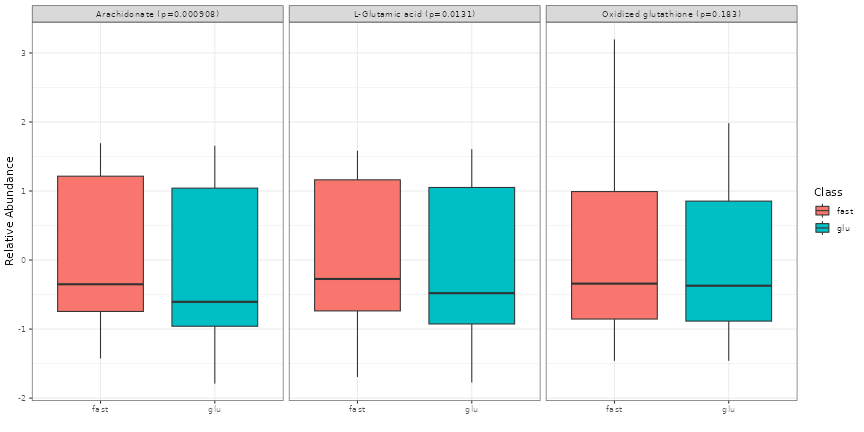
Also, for the box plots showing relative abundance of the hit metabolites: all of mine have values above and below 0. Should I interpret that as above normal (i.e. reference) abundance and below normal abundance?
Thank you