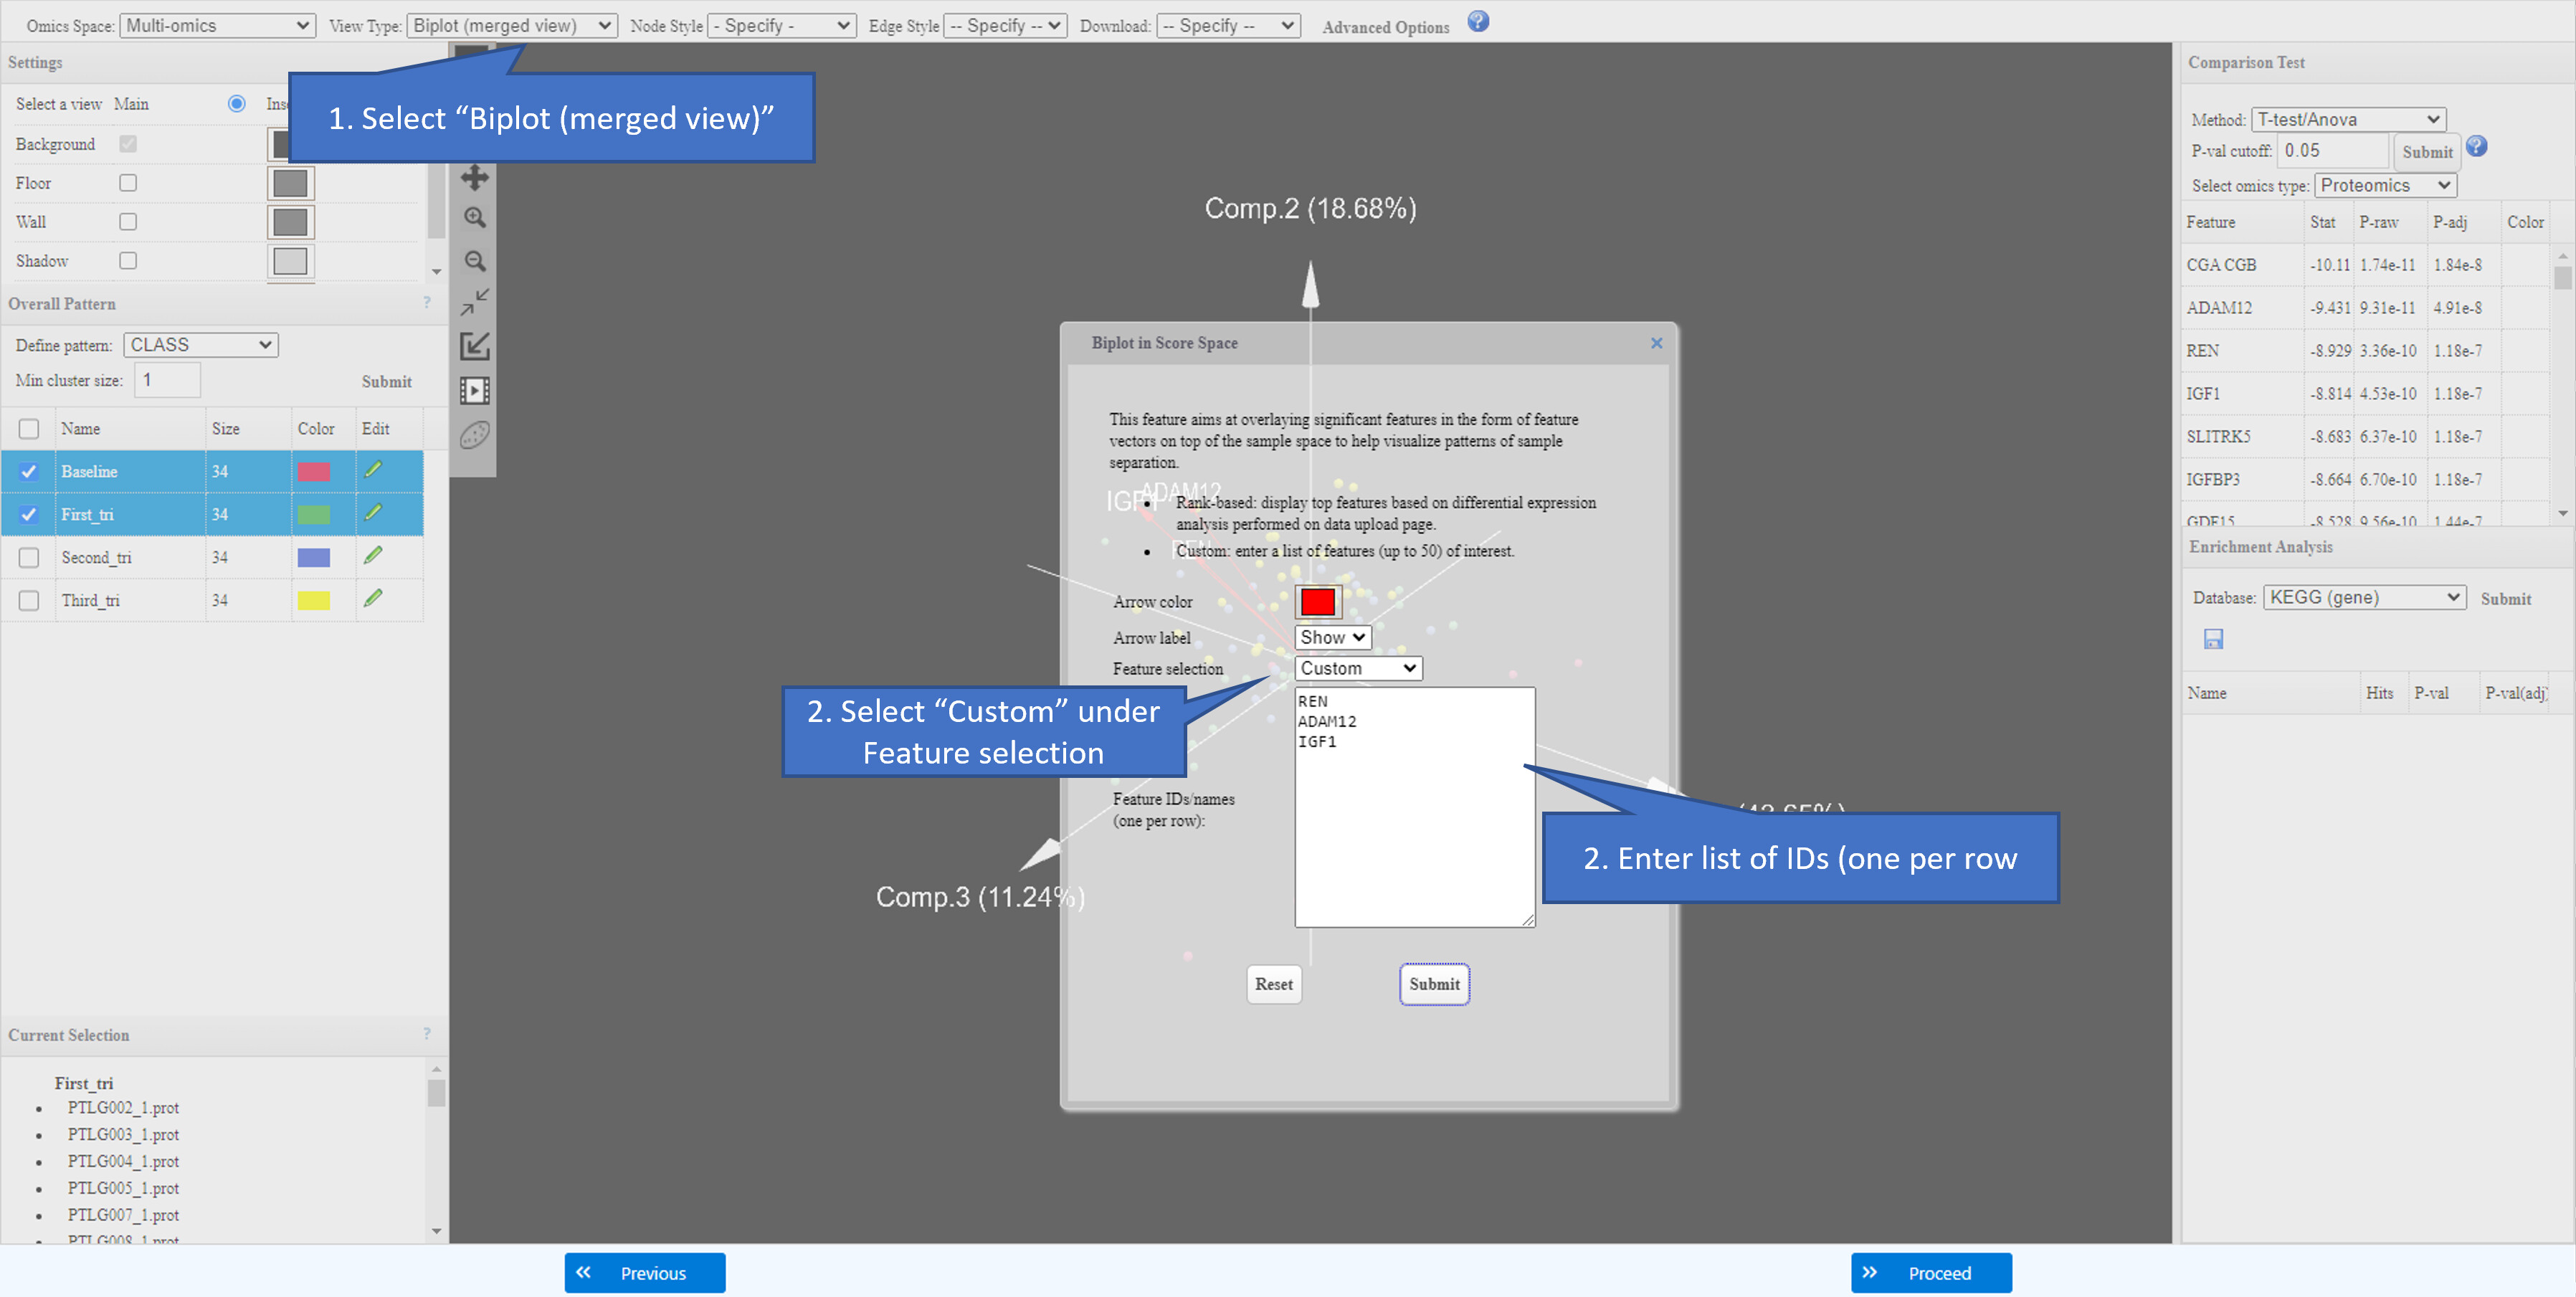
In the “Biplot (merged view)” dialog, select “Custom” under “Feature Selection” drop down menu. In the text area that appears, enter the list of features to be visualized as projected vectors on the sample space.